


1. Introduction
2. Material Preparation
3. Experimental Procedure
4. Computation of Creep Stiffness and m-value
5. Background Information of Statistical Comparison Method
6. Data Comparison
7. Summary and Results
1. Introduction
Low temperature cracking is a crucial pavement distress in asphalt layer built especially in cold regions during winter session (Marasteanu et al., 2009; Moon, 2010, 2012). When temperature drops to extremely low levels, remarkable tensile stress starts developing in the asphalt pavement layer, then finally it leads to the ignition of cracks (Moon, 2010, 2012). These cracks in pavement layer allow water infiltration of water and moisture into pavement layer. Finally, this procedure leads to total failure which can be one of significant distresses on existing pavement layer (Marasteanu et al., 2009; Moon, 2010, 2012). Therefore, it can be said that computation of thermal stress is a major role for predicting low temperature properties of given asphalt mixture (AASHTO, 2025).
The thermal stress values can be computed by means of simple mechanical performance testing methods named: Bending Beam Rheometer (BBR) (AASHTO, 2005; Marasteanu et al., 2009) and Indirect Tension (IDT) method (AASHTO, 2003). In both tests, two mechanical properties: creep stiffness S(t) and corresponding m-value can be computed. These two factors take a major role in thermal stress values. Moreover, the BBR mixture creep test has the potentials for being alternatives on computing low temperature properties of given asphalt material compared to the conventional testing method: IDT approach. The major advantages of applying BBR mixture test are: BBR mixture test is relatively cheep on budget and easier for test specimen preparations (Marasteanu et al., 2009; Moon, 2010, 2012).
In this paper, statistical and graphical analyses are performed to compare low temperature creep stiffness: S(t), and corresponding m-value from various asphalt mixtures. Based on this effort, the feasibility of applying BBR mixture creep test as an alternative on low temperature performance testing is evaluated and considered.
2. Material Preparation
In this paper, total six different asphalt mixture materials were prepared from MnROAD testing cell (Johnson et al., 2009). The prepared asphalt materials were prepared with Warm Mix Asphalt (WMA), Reclaimed Asphalt Pavement (RAP) and other agents. The schematic information of prepared material is shown in Table 1 (Marasteanu, 2009; Johnson et al., 2009).
From results in Table 1, it can be said that wide ranged characteristics of asphalt material including WMA and RAP are able to be tested for feasibility of BBR mixture test.
3. Experimental Procedure
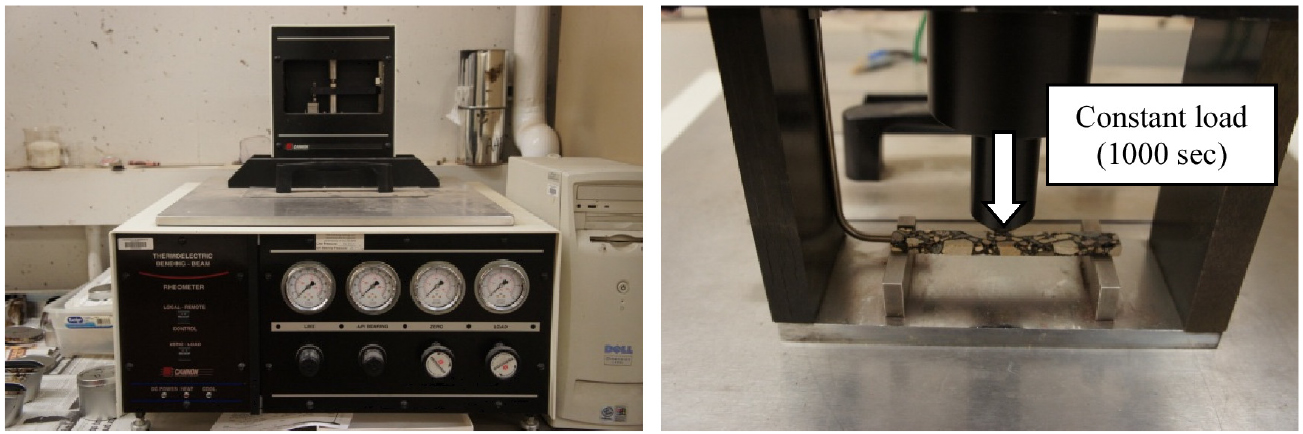
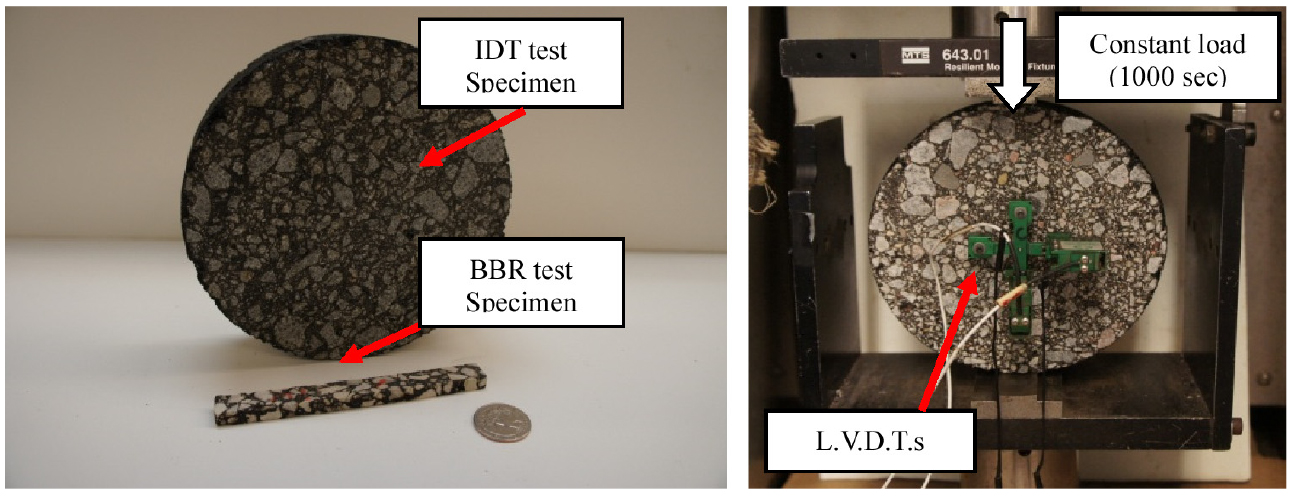
Two different low temperature performance testing methods: BBR and IDT mixture testing, were considered in this paper. Detailed information is provided in Tables 2 to 3 and Figs. 1 to 2 (AASHTO, 2003, 2005; Marasteanu et al., 2009).
Table 2.
Information of testing methods: BBR and IDT
Table 3.
Summary of BBR and IDT mixture testing
4. Computation of Creep Stiffness and m-value
In BBR mixture creep test, creep stiffness: S(t), and corresponding m-value can be computed as follows (see Eqs. (1) and (2)):
Where, S(t) = time dependent flexural creep stiffness, MPa;
= maximum bending stress in the beam, MPa;
= time dependent bending strain in the beam, mm/mm;
= constant applied load (3,000 ± 50 mN);
= length of specimen (102 mm);
= width of specimen (12.7 mm);
= height of specimen (6.35 mm);
= deflection of asphalt mixture beam, mm;
t = time, s
The corresponding m-value can be computed by fitting a second order polynomial function as (see Eqs. (3) and (4)):
According to AASHTO standards, a critical temperature: TCR is calculated from the lowest temperature at which the following two conditions (see Eqs. (5) and (6)):
Finally, 10°C are subtracted from this temperature determined from the S(t) and m(t) limits. Finally, the resulting temperature is set as the lower limit of the Performance Grade (PG) of the binder. This temperature correction process is mandatory because the low temperature pavement performance is correlated to creep stiffness obtained after 2h of loading. This correction process is determined based on Time-Temperature Superposition (TTS) principle for linear viscoelastic materials such as asphalt mixture (Anderson and Kennedy, 1993).
In IDT mixture creep test, creep stiffness: S(t), can be computed as (see Eqs. (7), (8), (9)):
Where, J(t) = creep compliance, 1/MPa;
= Measured horizontal deflection at time t, mm;
= Diameter of specimen (150 mm);
= Thickness of specimen (40 mm);
= Gauge Length (38 mm);
= Constant applied load, kN;
= strain in horizontal direction, mm/mm;
= strain in vertical direction, mm/mm;
Finally, creep stiffness: S(t) is derived as (see Eq. (10)):
5. Background Information of Statistical Comparison Method
A simple statistical testing method: hypothesis test, was applied to compare the computed results of S(t) and corresponding m(t) from BBR and IDT creep mixture test, respectively. The statistical comparison procedure was performed from 10 to 1,000 sec with 10 sec of interval.
In this statistical analysis procedure, two assumptions are set:
1. Each result of each test method follows normal distribution.
2. Each result of each test method has the same standard deviation.
In hypothesis test, null and alternative conditions are set as follows:
Null hypothesis:
Alternative hypothesis:
= Mean of creep stiffness from BBR mixture test
= Mean of creep stiffness from IDT mixture test
Then pooled standard deviation can be derived as follows:
Where, = Standard deviation of creep stiffness S(t) from BBR mixture test
= Standard deviation of creep stiffness S(t) from IDT mixture test
= Number of specimens used in BBR mixture test
= Number of specimens used in IDT mixture test
From Eqs. (11), (12), (13), t-statistic results can be derived as:
In hypothesis test, the degrees of freedom is calculated as follows:
A similar approach is applied compare the m-value: m(t) from BBR mixture and IDT mixture tests based on the previously mentioned computation step (i.e. see Eqs. (11), (12), (13), (14), (15)). Moreover, the t-critical level on this hypothesis test is set as: 2.7 and 3.1 (i.e. = 5% of error level). Then t-statistic plot was generated. If the t-static plot is located in t-critical level (i.e. 2.7) the null hypothesis (i.e. Eq. (11)) is accepted. Otherwise, if the computed t-critical value is located out of range, then the alternative hypothesis (i.e. Eq. (12)) is accepted.
6. Data Comparison
Based on the information mentioned previously, all the computed results (and/or comparison) are shown in Figs. 3, 4, 5, 6, 7, 8.
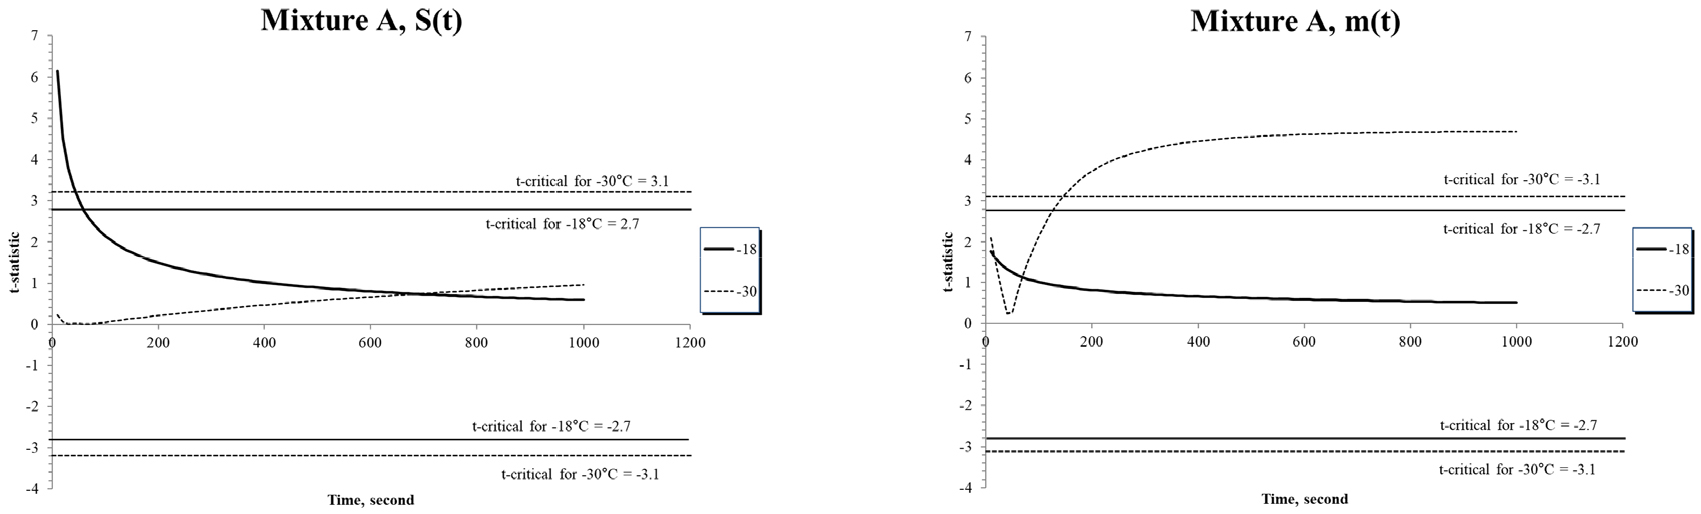
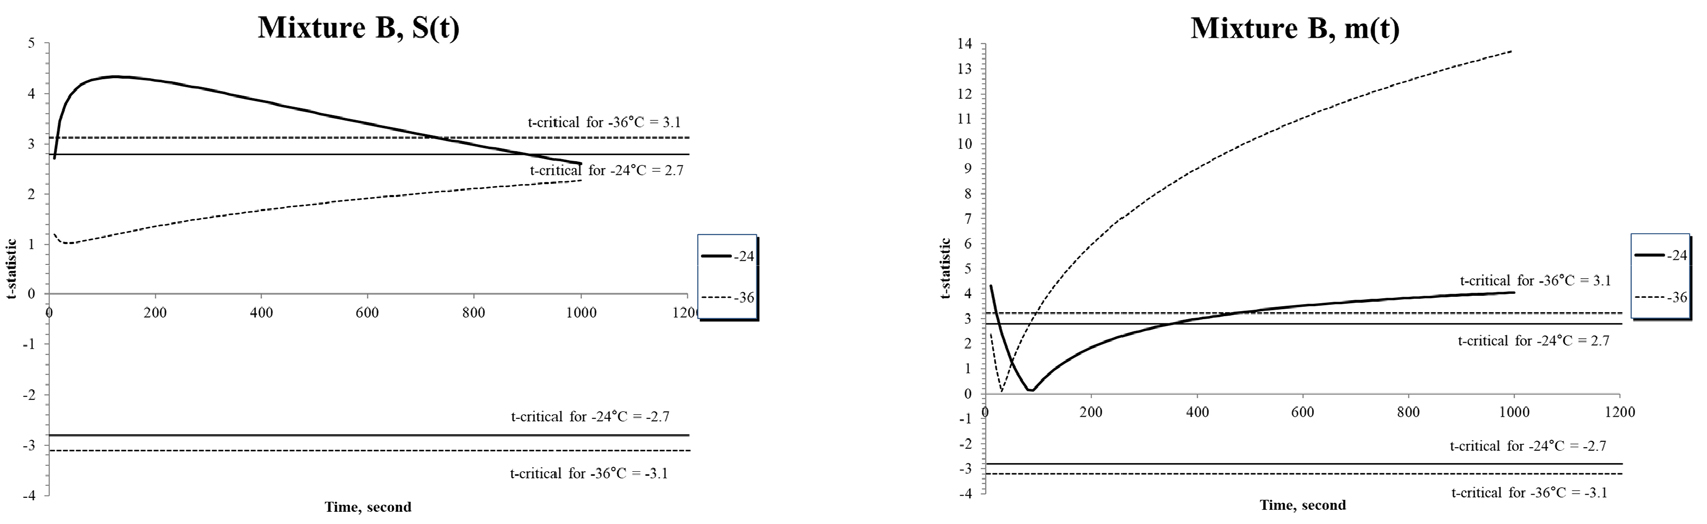
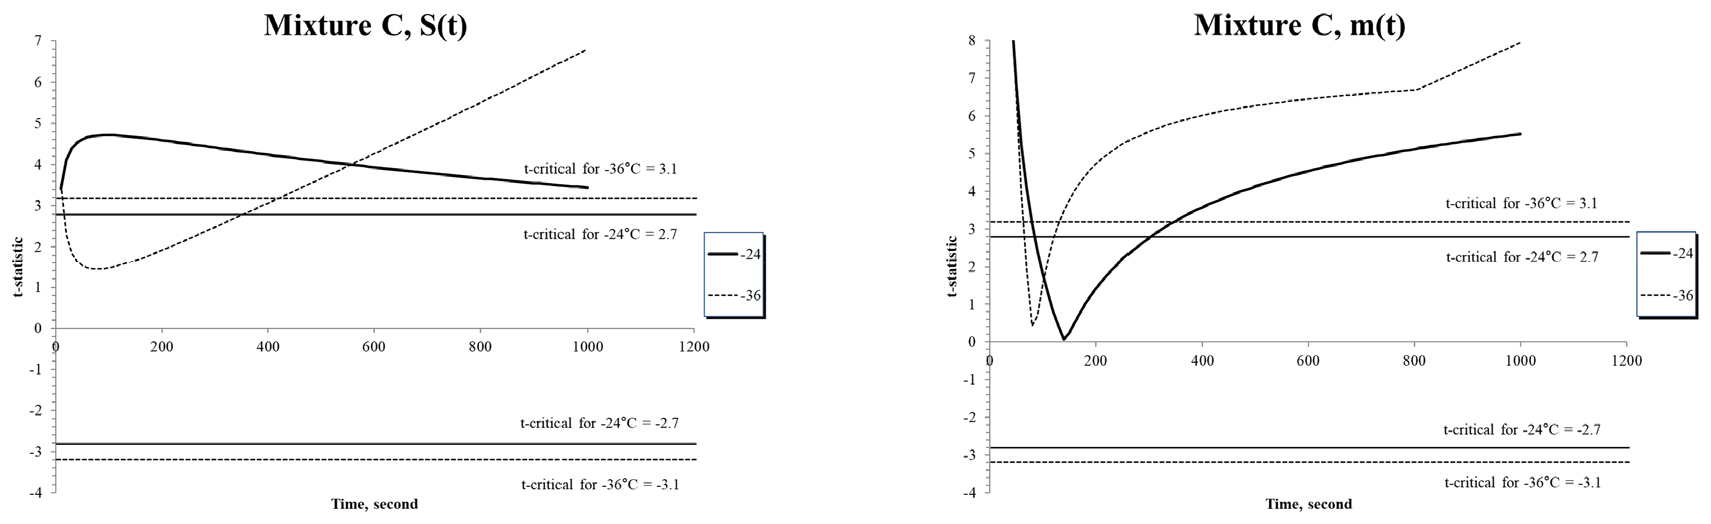
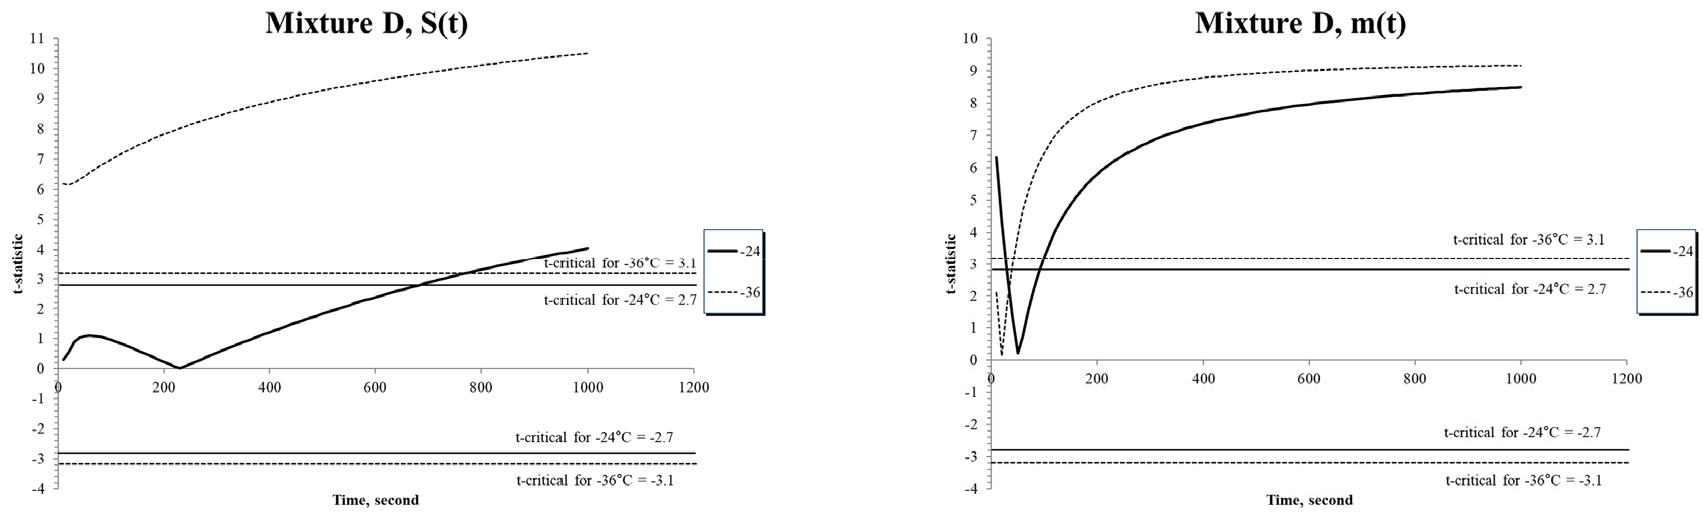
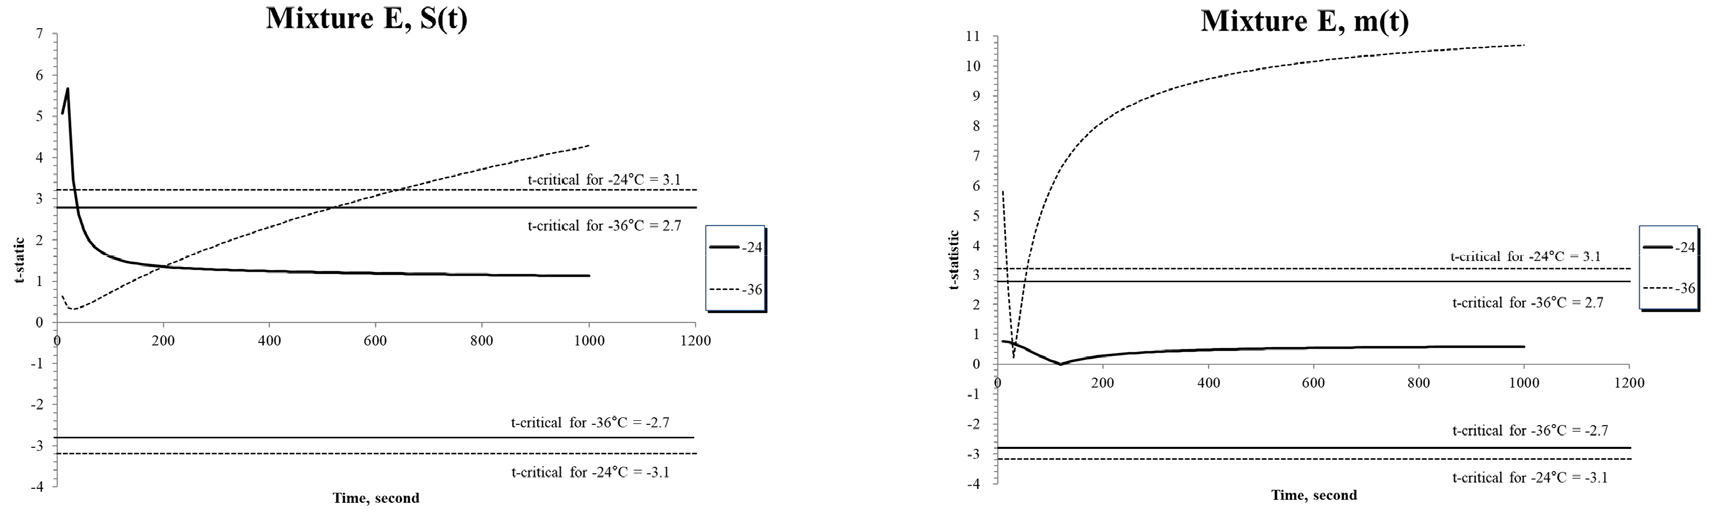
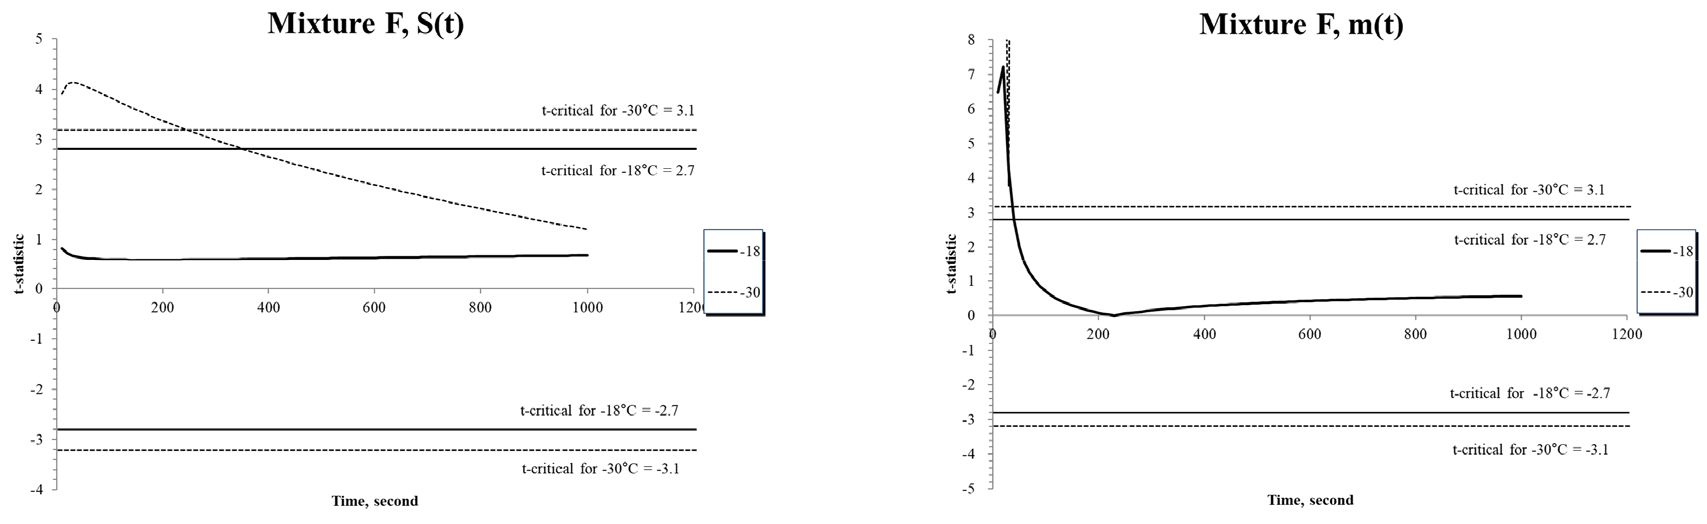
From the results in Figs. 3, 4, 5, 6, 7, 8, some viable results are derived:
1. All the tested asphalt mixtures except Mixture C (PG 64-34, No RAP) presented almost identical comparison results of S(t) between BBR and IDT mixture creep test.
2. At lower testing temperature, relatively poor comparison results of S(t) between BBR and IDT mixture creep test were derived. This means effects of size and elastic characteristics may affect the differences of S(t) result.
3. Even though good comparison results were derived on S(t) computation. However, for m(t) cases, all the tested asphalt mixtures presented poor comparison results.
4. It means that m(t) can’t be used for setting criteria of testing method comparison between BBR and IDT mixture creep test. To apply m(t) value for comparison, more extensive experimental works are needed as a future research.
5. This means BBR mixture creep test can successfully be an alternative testing tool for thermal stress computation. This possibility should be evaluated for next chapter of this study.
7. Summary and Results
In this paper, statistical and graphical analyses are performed to compare low temperature creep stiffness and corresponding m-value from various asphalt mixtures. It is finally found that BBR mixture testing method: a cheaper and easier testing approach compared to conventional IDT mixture testing method, can be a successful alternative for measuring low temperature properties of given asphalt mixtures. However, no reliable results on m(t) value comparisons were found and only S(t) comparison results were analyzed in this paper. The final goal in this research is: applying BBR mixture creep test for thermal stress calculation tool. Therefore, additional experimental and computation activities are needed for future research effort.