

1. Introduction
2. Materials and experimental works
2.1 Asphalt mixture preparation
2.2 Semi Circular Bending (SCB) low temperature fracture test
3. Data analysis
4. Summary and conclusion
1. Introduction
Using recycled (and/or alternative) aggregate material source is crucial in asphalt pavement area for reducing construction budget and environmental pollution issue (McDaniel et al., 2000; NCHRP, 2001; McNichol, 2005; Moon, 2010; Moon, 2012; Moon et al., 2013; Moon et al., 2014). During the past decades, the use of different types of alternative aggregate source such as Reclaimed Asphalt Pavement (RAP) and Taconite Aggregate (TA) has been widely and seriously considered (NCHRP, 2001; McNichol, 2005; Moon et al., 2013; Moon et al., 2014, Velasquez et al., 2009). In this paper, feasibility of applying TA in asphalt pavement area is considered.
The aggregate material named Taconite Aggregate (TA): a sedimentary rock composed of various iron formation (approximately 25~30%) mostly quarried and produced in northern Minnesota, was seriously considered as aggregate-alternative materials source by Minnesota Department of Transportation (MN/DOT) approximately for decades (Oreskovich et al., 2007; Velasquez et al., 2009; Zanko et al., 2003).
Every year over 125 million tons of taconite mining byproducts that could potentially used for aggregate source for pavement construction are generated in Minnesota (Oreskovich et al., 2007; Velasquez et al., 2009; Zanko et al., 2003). Previously, Natural Resources Research Institute (NRRI) at the University of Minnesota Duluth has addressed the suitability, economical viability and engineering possibility of applying TA on asphalt pavement industry area (Oreskovich et al., 2007). Taconite aggregate products are naturally hard, provides the high compressive strength due to iron-formation inside the aggregate structure. For instance, the compressive strength of TA ranges from 193 to 621 MPa compared to the compressive strength of conventional limestone (e.g. ranges from 55 to 179 MPa) and igneous rocks like granite and basalt/trap rock (e.g. ranges from 38 to 345 MPa), respectively (Oreskovich et al., 2007; Velasquez et al., 2009; Zanko et al., 2003). The specific gravity of TA ranges between 2.91 and 3.09 which is 10% higher than typical aggregates, and the absorption rate is around 1.16% compared to 0.74% for granite (Oreskovich et al., 2007; Velasquez et al., 2009; Zanko et al., 2003).
Based on some experimental works, it was found that TA mixture was able to present reasonable (and/or reliable) mechanical performance compared to the conventional asphalt mixture application in a limited research scope (Velasquez et al., 2009). However, not many studies presented low temperature fracture performance of TA mixture compared to the conventional asphalt mixture seriously. In this paper, a low temperature fracture properties of TA mixture compared to the conventional asphalt mixture was considered by means of SCB (Semi-Circular Bending) fracture (Falchetto et al., 2017) tests with visual inspections. As mechanical performance parameters, fracture energy: Gf, and fracture toughness: KI, were computed then compared visually.
2. Materials and experimental works
2.1 Asphalt mixture preparation
Total two different asphalt mixture sample specimens built by Super-pave Gyratory Compactor (SGC) with 7% of air void level were prepared at material lab in Korea Expressway Corporation Pavement Research Division (KECPRD). For all prepared mixtures, PG 64-34 asphalt binder (AASHTO, 2010) was applied. Schematic information of prepared asphalt mixtures in this paper is shown in Table 1.
Table 1.
Prepared asphalt mixtures
It needs to be mentioned that the TA aggregate was provided from University of Minnesota Twin Cities (UMTC) for asphalt mixture specimen preparation. Then the specimens were sent to UMTC again for further mechanical testing.
2.2 Semi Circular Bending (SCB) low temperature fracture test
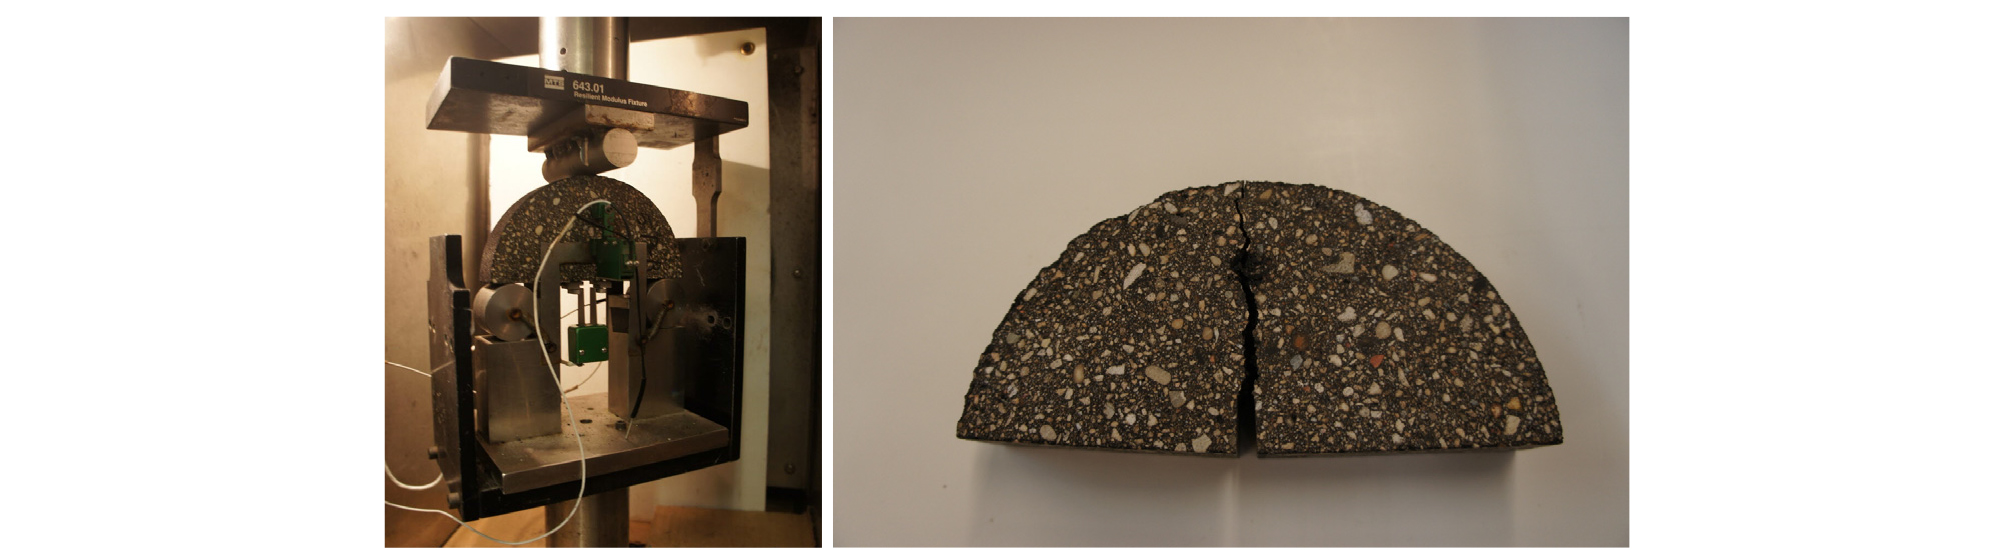
In SCB test, a special servo-hydraulic testing system equipped with a complicated environmental chamber was used (Li and Marasteanu, 2004; Li, 2005; Li et al., 2008). The SCB testing specimens was prepared from SGC with cutting of 25 mm of thickness and 75 mm of radius, respectively. The SCB samples were symmetrically supported by two fixed rollers and contains a span of 120 mm. The value of load line displacement (LLD) was recorded with a vertically mounted extensometer with 38±1 mm gage length measuring applicability. Moreover, another displacement measuring sensor was attached to a metal button glued to the sample for measuring a constant Crack Mouth Opening Displacement (CMOD) rate trend of 0.0005 mm/s. A contact load with maximum load of 0.3 kN was applied before the actual loading to ensure uniform contact between the loading plate and the specimen. The testing was stopped when the load dropped to 0.5 kN in the post peak region. All tests were performed inside an environmental chamber. Liquid nitrogen was used to obtain and control the required low temperature condition. The temperature was controlled by the environmental chamber temperature controller and verified using an independent thermometer.
Finally, the load and load line displacement (P-u) curve was generated. The data were used to calculate the fracture toughness: KI, and fracture energy: Gf. It was shown that the stress intensity factor (fracture toughness): K can be reasonably calculated using the following equations [see Eqs. (1) to (5)] on liner- viscoelastic condition as mentioned in the previous study (Li, 2005; Li and Marasteanu, 2008).
Where, KI = Mode I stress intensity factor (Li, 2005; Falchetto et al., 2017),
| $$\sigma_0=\frac P{2\cdot r\cdot t}$$ | (2) |
P = applied load,
r = specimen radius (=75 mm),
t = specimen thickness (=25 mm),
YI = the normalized stress intensity factor,
| $$Y_{I(s_0/r)}=C_1+C_2\cdot\left(\frac ar\right)+C_3\exp\left(C_4\cdot\left(\frac ar\right)\right)$$ | (3) |
Ci = constants,
a = notch length (20 mm),
| $$\frac{\triangle s_0}r=\frac{s_a}r=\frac{s_0}r$$ | (4) |
= actual span ratio,
= nearest span ratio analyzed in the derivation of this equation (0.80, 0.67, 0.61, 0.50)
| $$B=6.55676+16.64035\cdot\left(\frac ar\right)^{2.5}+27.97042\cdot\left(\frac ar\right)^{6.5}+215.0839\cdot\left(\frac ar\right)^{16}$$ | (5) |
The fracture energy Gf was calculated according to the current specification that has been applied in the study of concrete (Li, 2005; Li and Marasteanu, 2008; Falchetto et al., 2017). The work of fracture is the area under the loading-deflection (P-u) curve and the fracture energy: Gf, can then be obtained by dividing the work of fracture with the ligament area, which is calculated as the product of the ligament length and the thickness of the specimen. This is shown in Eq. (6).
| $$G_f=\frac{W_f}{A_{lig}}$$ | (6) |
| $$W_f=\int_{}^{}Pdu$$ | (7) |
In Eqs. (6)~(7), Wfand Alig mean the work of fracture and the area of the ligament, respectively.
Fig. 3 presents the testing set up of SCB test. In this paper, two mechanical properties: fracture energy (Gf) and fracture toughness (KI), were computed and compared.
In SCB fracture test, two different temperature conditions: -12°C (lowPG+10+12°C: high temperature), -24°C (lowPG+10: low temperature), were considered for extensive visual comparison (Falchetto et al., 2017). At each temperature, two specimens were considered for testing work therefore, total four asphalt mixture specimens were used for each testing set in SCB test (see Table 1). Fig. 1 presents schematic testing information of SCB testing performed in this study.
3. Data analysis
As mentioned in the previous section (Section 2), two major fracture performance parameters at low temperature: fracture energy (Gf) and fracture toughness (KI), were computed based on Eqs. (1) to (7) then compared (Li, 2005; Li and Marasteanu, 2008). All the computed results are shown in Table 2. In addition, the P-u (load and LLD displacement) plots for Mixtures A and B are shown in Figs. 2 to 3.
Table 2.
Summary of fracture toughness and fracture energy results
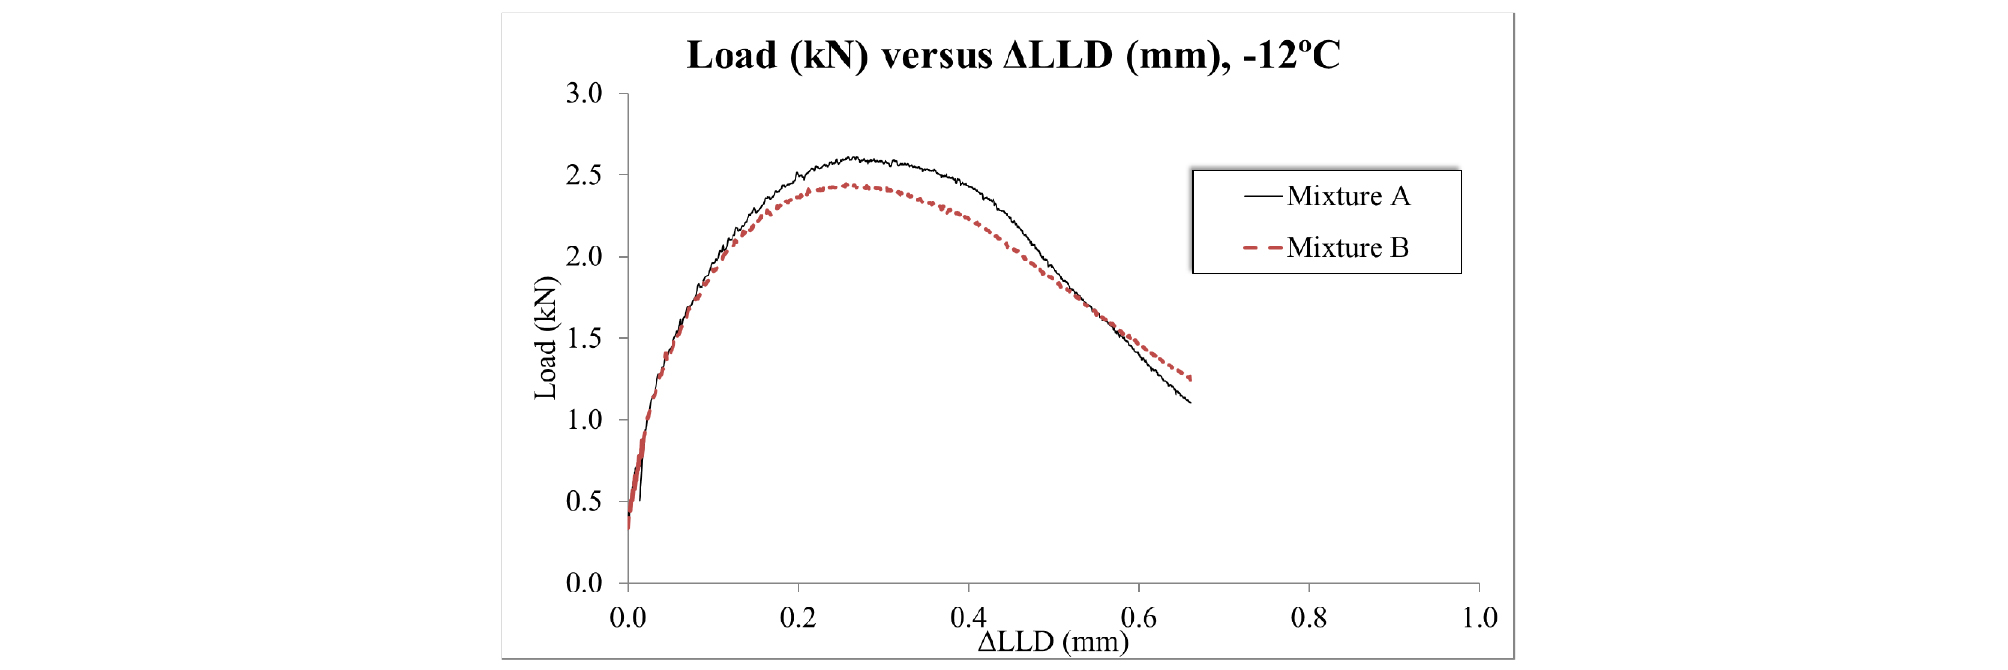
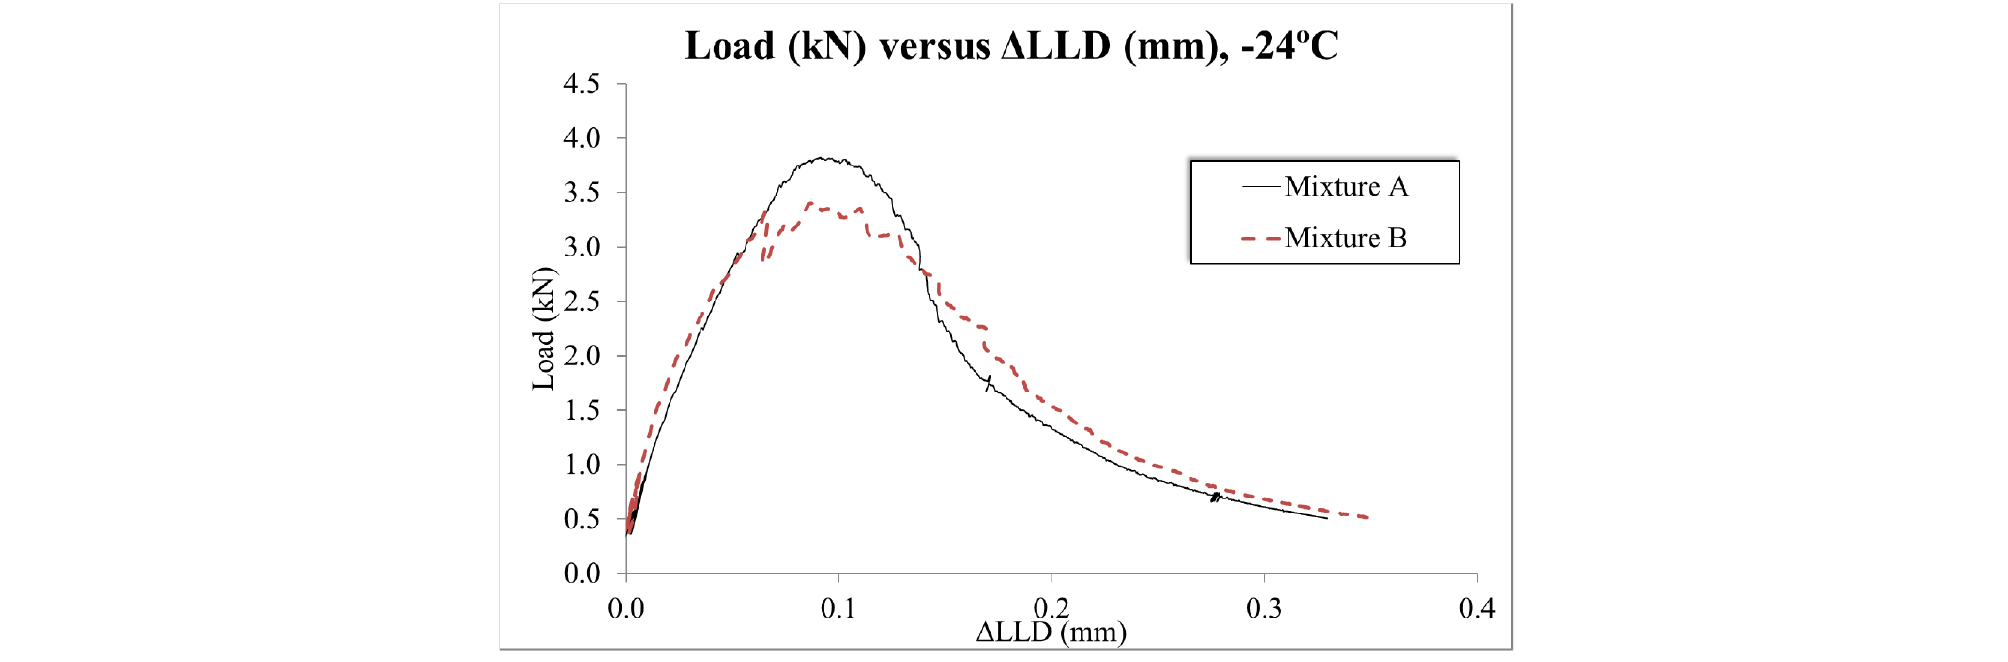
From results in Table 1 and Figs. 2 to 3, it can be said that higher fracture energy: Gf, and fracture toughness: KI, were observed in conventional asphalt mixture (Mixture A) compared to TA mixture as expected. However, it needs to be mentioned that only 3~4% difference in Gf computation and 2~5% difference in KI computation were found in TA mixture compared to the conventional asphalt mixture (see Table 1).
Moreover, the crack initiation, progress and relaxation pattern (see Figs. 2 and 3) presented similar data generation trend on TA mixture compared to the conventional asphalt mixture. Based on the findings it can be said that there is a possibility for application of TA on asphalt pavement industry area. However, only limited experimental works were performed therefore, more extensive research efforts are needed in the future research.
4. Summary and conclusion
In this paper, feasibility of TA application on asphalt mixture was considered. As an experimental work, SCB fracture test was performed and two crucial mechanical properties: fracture energy and fracture toughness, were computed then compared graphically. As expected, asphalt mixtures with Taconite Aggregate (TA) presented negative fracture performance at low temperature compared to conventional asphalt mixtures. However, only non-remarkable differences of low temperature fracture performance on TA mixture were found which means there is a possibility for application of TA in asphalt pavement industry. However, only limited number of specimen and experimental works were considered in this paper. The extended laboratory efforts, additional mathematical modeling considerations, performing numerical pavement analysis and 2D/3D Finite Element Method (FEM) simulation works are further recommended as a future research.
