

1. Introduction
2. Runoff Coefficient & Maximum Runoff Amount Rate of Rainwater
2.1 Runoff Coefficient of Rainwater
2.2 Maximum Runoff Amount Rate
2.3 Application of Maximum Runoff Amount Rate to Evaluate Permeability Pavement
3. Definition of Relevant Technical Term
4. Evaluation Method of Maximum Runoff Amount Rate
4.1 Set of the Standard of the Maximum Runoff Amount Rate
4.2 Making Hyetograph and Calculation of Effective Rainfall
4.3 Pavement Structure and Characteristic Values of Materials Used
4.4 Making Runoff Hydrograph and Calculation of Maximum Runoff Rainwater Amount
5. Case Study of the Permeability Pavement used for Field Trial
5.1 Outline of This Permeability Pavement and Input Data
5.2 Simulation Results
6. Summary
1. Introduction
The year of 2019 was a year when the devastating rainfall and the urban flood were frequently taking place in Japan. As I referred in the journal, in spite of the fact that about 20 years have passed after the permeability pavements were paved, there were no severe problems especially with the structural deterioration in the pavements. We have learned water should not enter the pavement because the structural damage would take place, and we have been holding the theory for a long time. But, the results of the field trials for the permeability pavements have demolished the conventional theory and taught us the permeability pavements would be able to be sustainable and contribute to mitigating the urban flood by permeating the rainwater or storing the rainwater tentatively.
Under such circumstances, what I have to do now is to introduce and spread the calculation method of runoff amount of rainwater in the case of using the permeability pavement and to spread widely the permeability pavement itself to control the urban flood.
Regarding the calculation method of the runoff amount of rainwater through the permeability pavement, Public Works Research Institute in Japan, PWRI, has developed it in 2005, and it has been elaborated in “Road surface rainwater treatment manual (draft) (PWRI, 2005)”, “Appendix of Pavement Performance Evaluation Method JRA, 2008)”, “Calculation Guidebook on Reduction of Environmental Loads (JRA, 2014)”. And, the calculation method has been released as an Excel file, the person who bought the book (JRA, 2014) can get the excel file free charge.
Here, I would like to elaborate on the calculation method in detail.
2. Runoff Coefficient & Maximum Runoff Amount Rate of Rainwater
2.1 Runoff Coefficient of Rainwater
In the “Act on countermeasure against flood damage of the specific river running across cities” enacted in June 2003, the peak runoff rainwater amount in the standard rainfall intensity (10 years probability rainfall), which is the maximum runoff rainwater amount calculated every 10 minutes in the developed area, must be controlled to be the same or smaller rather than that before development.
The runoff coefficient has been designated in the Announcement No. 521 from Japanese MLIT, Japanese Ministry of Land, Infrastructure and Transport, “Announcement to determine runoff coefficient for each land use used in calculating maximum runoff”. An example is as follows (MLIT, 2009).
Table 1.
Example of runoff coefficient (MLIT, 2009)
| Classification | Runoff Coefficient |
| Housing land | 0.90 |
| Road (Dense-graded pavement) | 0.90 |
| Macadam road | 0.50 |
| Mountain land | 0.30 |
| Play ground | 0.80 |
| Forest land, Farmland, Wilderness, etc. | 0.20 |
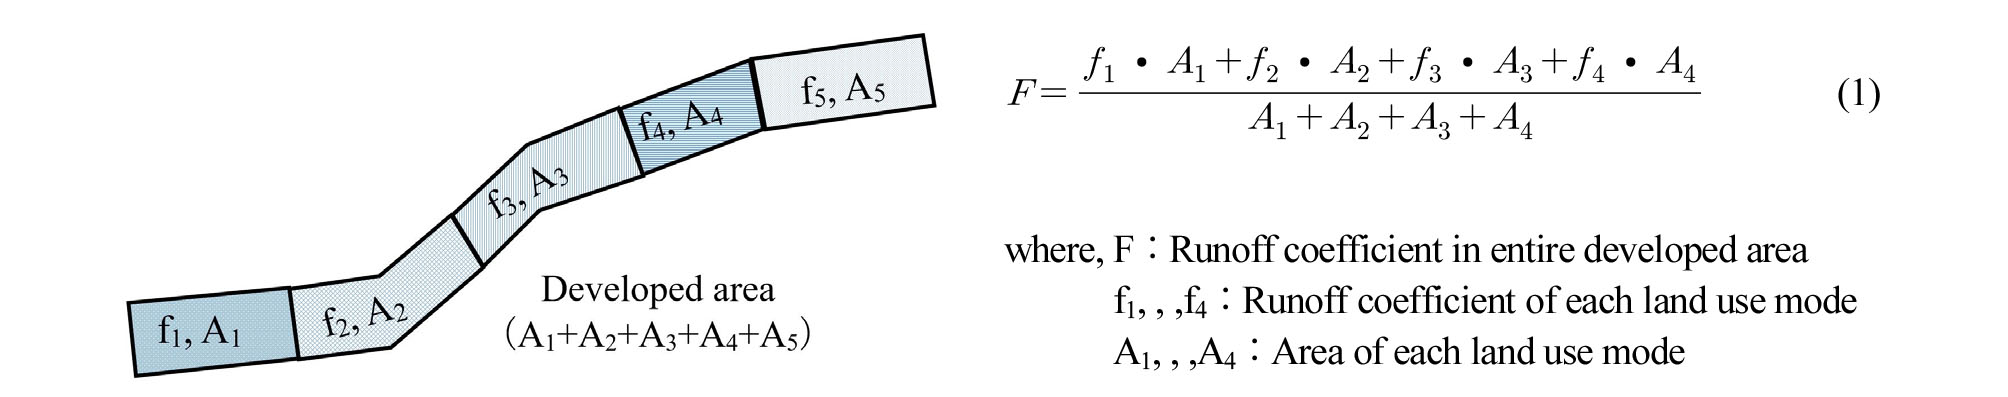
The runoff coefficient (F) for the entire development area is determined by proportionally dividing the runoff coefficient for each land use mode by the total area. An example is as shown in Eq. (1).
2.2 Maximum Runoff Amount Rate
The maximum runoff amount rate is the rate of the maximum runoff rainwater amount, which would be discharged to the rivers through the drainage facilities, against the maximum rainfall. The smaller the maximum runoff amount rate shows that the effect of restraint of runoff of rainwater is higher. The runoff coefficient shown in the former section is based on only the natural percolation and is a constant which does not depend upon the kinds of the pavement, existence or non-existence of the percolation facilities, and other (Ichikawa et al., 1984). Therefore, the entire runoff restraint performance of the permeability pavement including the water storage facilities and/or percolation facilities cannot be evaluated. Here, the maximum runoff amount rate is selected as an index that can evaluate the rainwater runoff restraint performance of the permeability pavement and others (Wada and Miura, 1995).
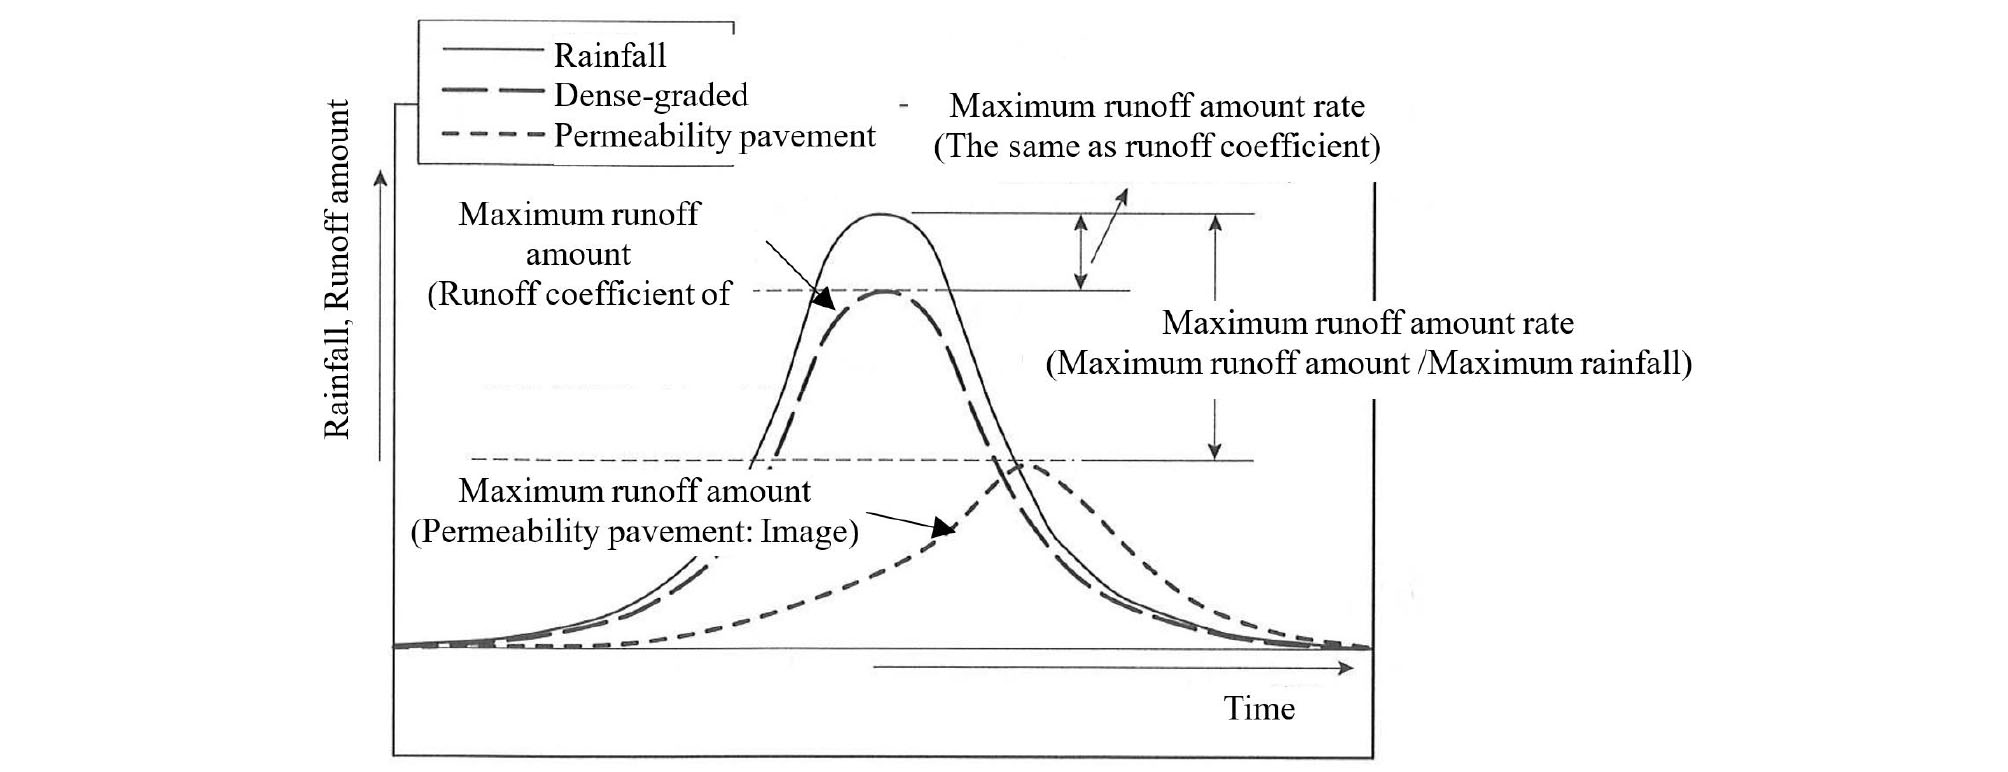
In the case of the impervious pavement like a dense-graded pavement, when the rainfall is the maximum, the runoff rainwater amount is also the maximum. Therefore, the maximum runoff amount rate and the runoff coefficient become the same as shown in Fig. 2. In the case of the pavement in which rainwater can permeate or can be stored tentatively, however, the maximum runoff rainwater amount reaches the maximum after the rainfall peaks. Furthermore, because the runoff amount at each time is changing regardless of the rainfall shape, it would be inadequate to calculate as a rate of the runoff rainwater amount to total rainfall (Masuyama et al., 2001). Because the runoff coefficient cannot explain well, the maximum runoff amount rate obtained by the rate of the maximum runoff rainwater amount to the maximum rainfall shall be used.
2.3 Application of Maximum Runoff Amount Rate to Evaluate Permeability Pavement
The example shown in Fig. 1 is based on the “Act on countermeasure against flood damage of the specific river running across cities”. If considering the recent devastating damages by the urban floods caused by the abnormally high rainfall intensity, however, the countermeasure that the conventional pavements should be changed into the permeability pavement should be required. That is because the improvement in the maximum runoff amount rate should be expected by changing the conventional pavement into the pavement which has the functions of subgrade percolation of the rainwater and/or tentative rainwater storage. If the calculation and/or the simulation of the runoff amount before and after changing the conventional pavement into the permeability pavement would become possible, more specific judgment about whether changing the pavement or not by the governments would become also feasible.
3. Definition of Relevant Technical Term
The technical terms used in this paper are defined as follows.
Table 2.
Technical term
4. Evaluation Method of Maximum Runoff Amount Rate
The flow of the calculation method of the maximum runoff amount rate is as follows.
1) Setting the standard of the Maximum runoff amount rate.
2) Making hyetograph and calculation of effective rainfall
3) Pavement structure and Characteristic values of materials used.
4) Making Runoff hydrograph by water-balance and Calculation of maximum runoff rainwater amount.
5) Calculation of Maximum runoff amount rate.
6) Evaluation in comparison with the standard.
4.1 Set of the Standard of the Maximum Runoff Amount Rate
In the basin of the river designated as the specific river running across cities, when the development, which is regarded as the development blocking the rainwater percolation like paving work larger than a certain scale, would be done, the standard shall be set up so that the maximum runoff rainwater amount after development does not exceed that before the development.
4.2 Making Hyetograph and Calculation of Effective Rainfall
In making a hyetograph (rainfall waveform), the probability rainfall intensity formula is used. The probability rainfall intensity formula is normally expressed shown in Eq. (2) and the formula is determined in each local government.
| $$r_t=\frac a{t^n+b}\times100$$ | (2) |
where, rt : Probable rainfall intensity (mm/h)
t : rainfall continuation time (min)
a, b, n : constant
Here, taking an example of a=1452, B=7.5, and n=0.7, the explanation would be continued. In the “Act on countermeasure against flood damage of the specific river running across cities”, 24-hour centralized rainfall waveform of 10-year probability rainfall intensity is supposed to be made at the interval of 10 minutes. Using the 10-year probability rainfall intensity, the probability rainfall amount from t1 minute to t2 minute since the start of the raining can be obtained by Eq. (3).
| $$R_{t1-t2}=\frac{r_{t2}}{60}\times t_2-\frac{r_{t1}}{60}\times t_1$$ | (3) |
where, Rt1-t2 : probable rainfall amount from time “t1” to time “t2” (mm)
rti : Probable rainfall amount at the time “t1” (mm/h)
rt2 : Probable rainfall amount at the time “t2” (mm/h)
If inputting the time at the 10 minutes interval into Eq. (3), the equation is as shown as follows;
・・・・・
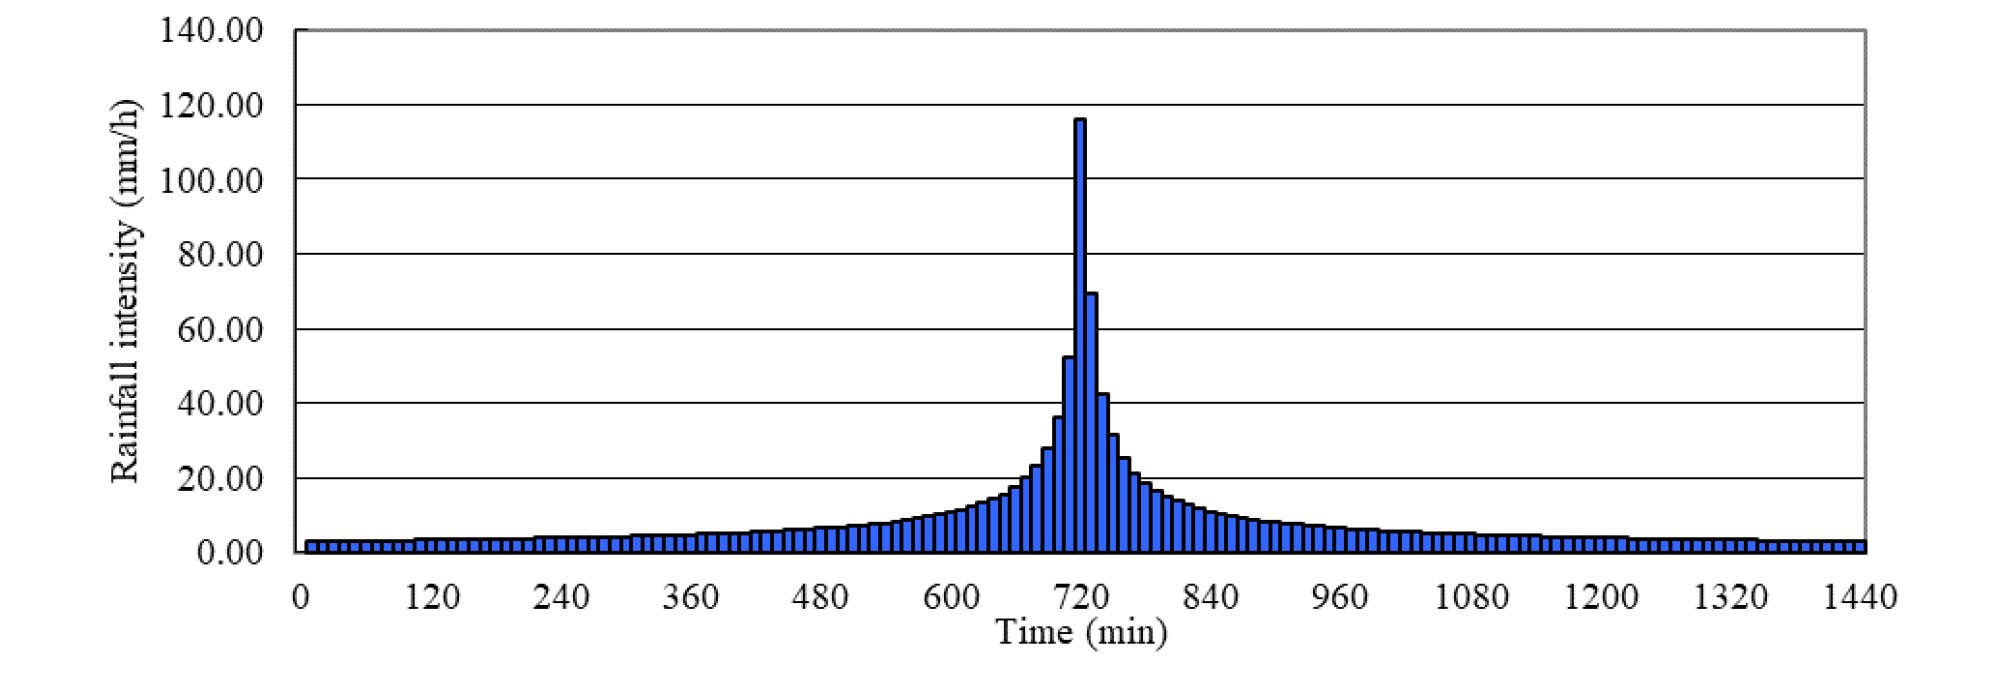
In the case of making the rainfall waveform for 24 hours (1440 minutes) at an interval of 10 minutes, the number of the data is 144. To arrange the data into 24-hour centralized rainfall waveform, R0-10 of the probability rainfall intensity which is the heaviest shall be put to the center (No.72), the next heaviest probability rainfall intensity (R10-20) shall be put to the No.73, and the next one (R20-30) shall be put to No. 71. Hereinafter, the processing of alternately arranging left and right in the descending order of rainfall is repeated.
The hyetograph which was made in such a way is shown in Fig. 3.
There is rainfall which is not coming to the pavement by blocking by trees and so on in the rainfall shown in the hyetograph. Therefore, when calculating the water-balance in the permeability pavement, the effective rainfall obtained from Eq. (4) shall be used.
| $$M=0.9\times R$$ | (4) |
where, M: Effective rainfall, R: Rainfall from hyetograph
4.3 Pavement Structure and Characteristic Values of Materials Used
Using the core samples taken from the paving site, the characteristics values like water restraint rate and water storage rate of each layer of the pavement and the saturated permeability coefficient of subgrade shall be obtained. Furthermore, a specific percolation amount is needed in the case of subgrade percolation is expected, the information, like the diameter and the runoff coefficient of drainpipe, and the collection water area (interval of drainpipe x width of the pavement) per a drainpipe, is collected when the drainpipe is used.
4.4 Making Runoff Hydrograph and Calculation of Maximum Runoff Rainwater Amount
Preparation of runoff hydrograph and calculation of the maximum runoff rainwater amount can be easily done by using the program incorporated in Excel. Here, the basic idea and calculation method for the water-balance are briefly introduced.
4.4.1 Calculation Method of Water Restraint Amount and the Maximum Water Storage Amount
The water storage rate shown in Table 3 includes the water restraint rate. The maximum storage amount is calculated by subtracting the water restraint rate from the water storage rate as shown in Table 4.
Table 3.
Data information needed for calculation of maximum runoff amount rate
Table 4.
Calculation example of the maximum water storage amount
4.4.2 Outline of Calculation Procedure for Water-balance
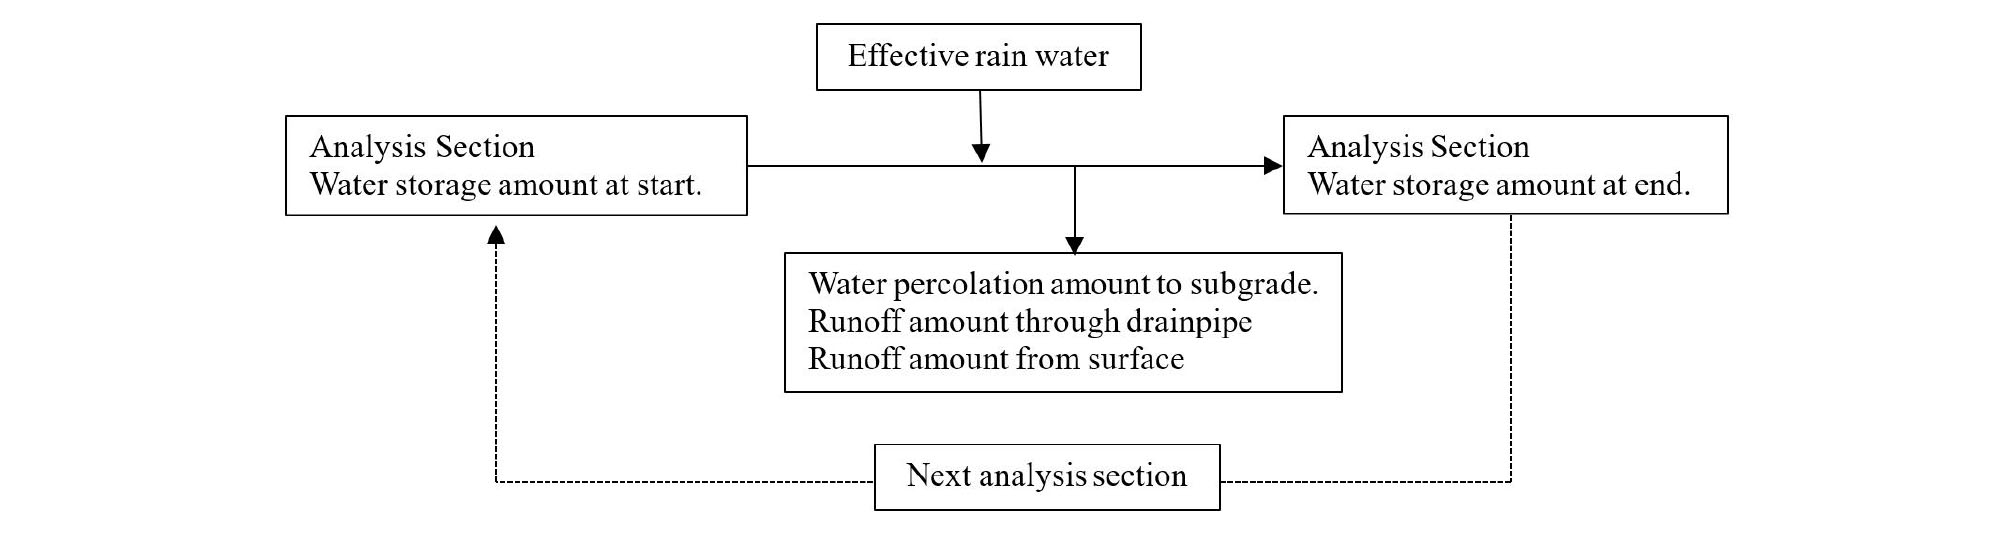
Regarding the permeability pavement targeted to the evaluation, the water storage rate and the water restraint rate are different by the materials used for the layers. And, the change in the water-level from the subgrade to the surface cannot express by the simple mathematical formula. Therefore, the water storage amount in the permeability pavement shall be sequentially calculated by calculating the water-balance in each time section as shown in Fig. 4.
4.4.3 Explanation of Calculation Process
Although the calculation is very easy if using an Excel file, here, the calculation process is explained. Table 5 shows the calculation conditions.
Table 5.
Calculation conditions
4.4.3.1 Calculation of Subgrade Percolation Capacity and Drainpipe Runoff Capacity
Table 6 shows the calculation example of the subgrade percolation capacity and the drainpipe runoff capacity and demonstrates the process to calculate the subgrade percolation capacity and the drainpipe runoff capacity based on the water-level at the start of analysis.
Table 6.
Calculation example of “Possible subgrade percolation amount” and “Possible runoff amount through drainpipe” (MLIT, 2009) Analysis time section: from 730 to 740 (minute)
4.4.3.2 Calculation for Water-balance
Table 7 shows the example of water-balance calculation, it demonstrates the process to calculate the water storage amount at the end of analysis time and the surface runoff amount. By subtracting sequentially “water restraint amount at end”, “subgrade percolation amount” and “drainpipe runoff amount” from the total of “water restraint amount at start”, “water storage amount at start”, and “effective rainfall”, both of “water storage amount at end” and “Surface runoff amount” are calculated.
Table 7.
Calculation example of “Water balance” Analysis time section: from 730 to 740 (minute)
Calc.-5: Water restraint amount at the start in analysis time section, shown in Table 4.
Calc.-6: Water storage amount at the start in analysis time section
Calc.-7: M=0.9×Rainwater obtained from Hyetograph
Calc.-8: Smaller one of 1) and Maximum water restraint amount in Table 4. [50.11>13.9: 13.9]
Calc.-9: Smaller one of 2) and subgrade percolation capacity Qr shown in Table 6. [36.21>0.15: 0.15]
Calc.-10: Smaller one of 3) and drainpipe runoff capacity Qp. shown in Table 6. [36.06>6.17: 6.17]
Calc.-11: Smaller one of 4) and Maximum water storage amount in Table 4. [29.89<43.71: 29.89]
Calc.-12: Value of 5). [0.00]
4.4.3.3 Calculation of Water-level in Pavement
Table 8 shows the example of calculation for water-level in the pavement. This shows the process of calculation to derive the water-level in the pavement from the water storage amount at End obtained in Table 7. The detail of the calculation procedure is as shown below.
Table 8.
Calculation example of water-level in pavement at end of analysis time (at 740 minute) Analysis time section: from 730 to 740 (minute)
1) The numerical values in the relevant items in Table 4 are input into the columns in Table 8, “(h) Layer thickness”, “(i) Water restraint amount of each layer”, and “(j) Maximum water storage amount of each layer”.
2) “Water storage amount at End”, 29.89, obtained in Table 7 is input into the “(k) Water storage amount” of the sub-base course in Table 8.
3) The smaller one of “(j) Maximum water storage amount of each layer” and “(k) Water storage amount” of the sub-base course in Table 8 is input into “(l) Water storage in each layer” of the sub-base course shown in Table 8. This shows the water amount which would be stored in the sub-base course.
4) The difference of “(k) Water storage amount” and “(l) Water storage in each layer” is input into “(m) Water storage to upper layer” of the sub-base course. This shows the water amount which would be stored in the upper layer of the sub-base course.
5) “(n) Water level” shown in Table 8 shows the water level from the bottom of the sub-base course, which is calculated from the thickness and the water storage amount of each layer.
6) “(k)Water storage amount” in the base course layer shows the water storage amount, which cannot be stored in the sub-base course and shows the same meaning and the same value of “(m) Water storage to upper layer” in the sub-base course.
7) If repeating sequentially the same procedure as the same as above and totalizing them, the water level in the pavement can be derived.
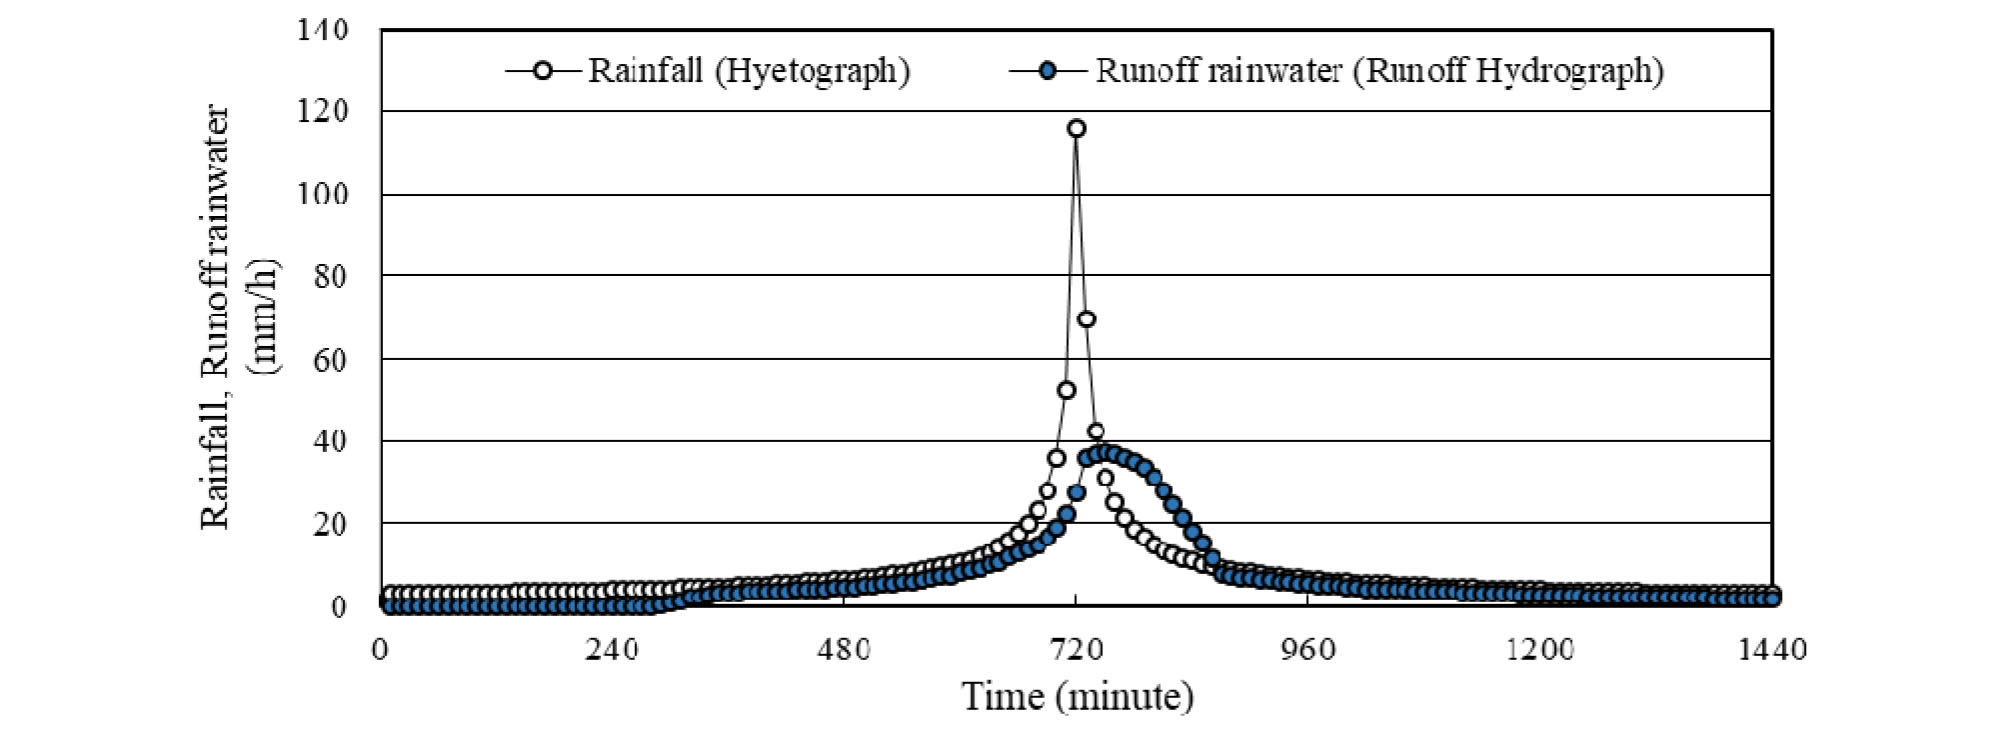
4.4.4 Making Runoff Hydrograph and Calculation of Maximum Runoff Rainwater Amount
Runoff rainwater amount is calculated by summarizing the drainpipe runoff amount and the surface runoff amount. And, the runoff hydrograph of the entire runoff rainwater amount in the evaluation target area is made and the maximum runoff amount rate is calculated by dividing the maximum runoff rainwater amount by the maximum rainfall. Table 9 and Fig. 5 demonstrate the calculation results of runoff and runoff amount rate derived in this example.
Table 9.
Calculation results
As shown in Table 9, the maximum runoff amount rate (0.32) satisfies the maximum runoff amount rate targeted (0.41). In addition, if evaluating the results for 24 hours, the rainwater of 105.3 mm permeates into the subgrade and the rainwater corresponding to 911.6 mm is drained to the drainage facilities like a river. The rest amount from the total rainfall of 1229.9 mm is that restrained and stored in the pavement. The saturated permeability coefficient of the subgrade of this pavement is as small as 1.879 x 10⁻⁵ mm/s. However, a certain amount of rainfall can be permeated into the subgrade, it contributes to the reduction in the rainwater amount drained to a river.
5. Case Study of the Permeability Pavement used for Field Trial
5.1 Outline of This Permeability Pavement and Input Data
The permeability pavement (Nakanishi, 2001) used for a case study has been constructed on the national road route-155 in August 2000 in Japan. The outline of this pavement was already introduced in the former journal of KAI, but here, further detail information is provided and required input data are arranged as shown in Fig. 6, Table 10 and Table 11.
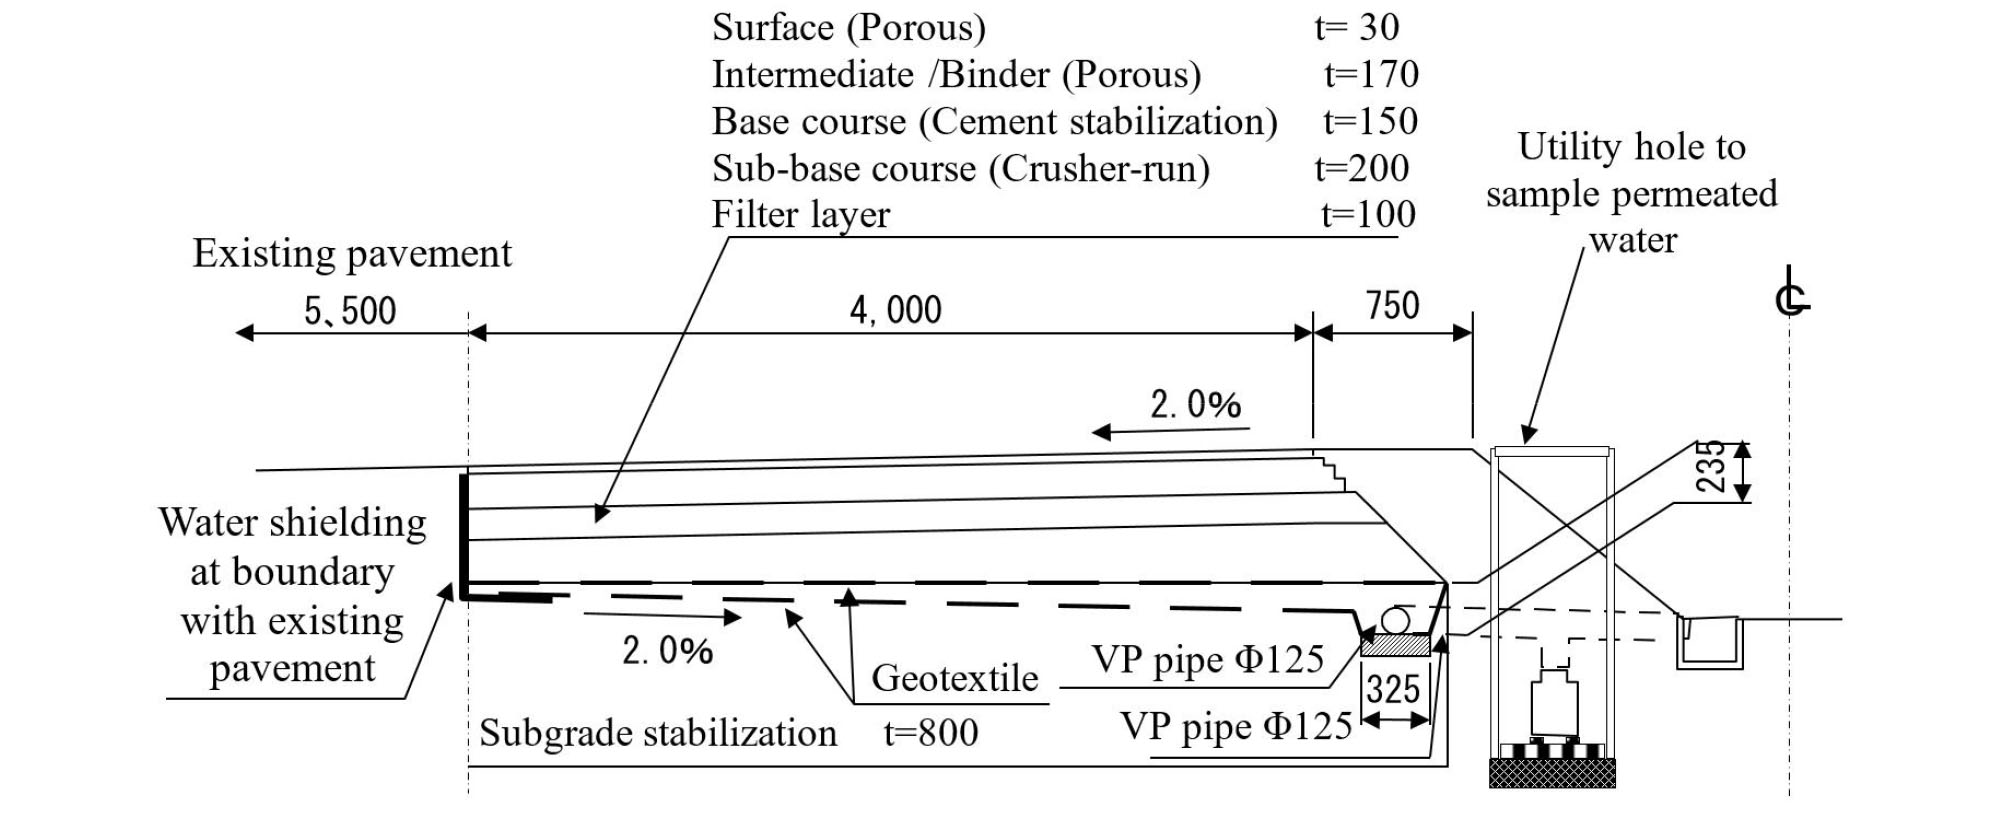
Table 10.
Input data for case study
1) As shown in Table 3, Water restraint rate is set to be 1.5% for asphalt mixture and 0.5% for granular material.
2) As shown in Table 3, water storage rate is set to be air-void -6% for asphalt mixture and Air-void-3% for granular.
3) Filter layer shall be included into Sub-base course for calculation. As a result, the total thick ness: 30 cm, Water restraint rate: 0.5%, And Water storage rate: 12.84%.
Table 11.
Input data for case study
5.2 Simulation Results
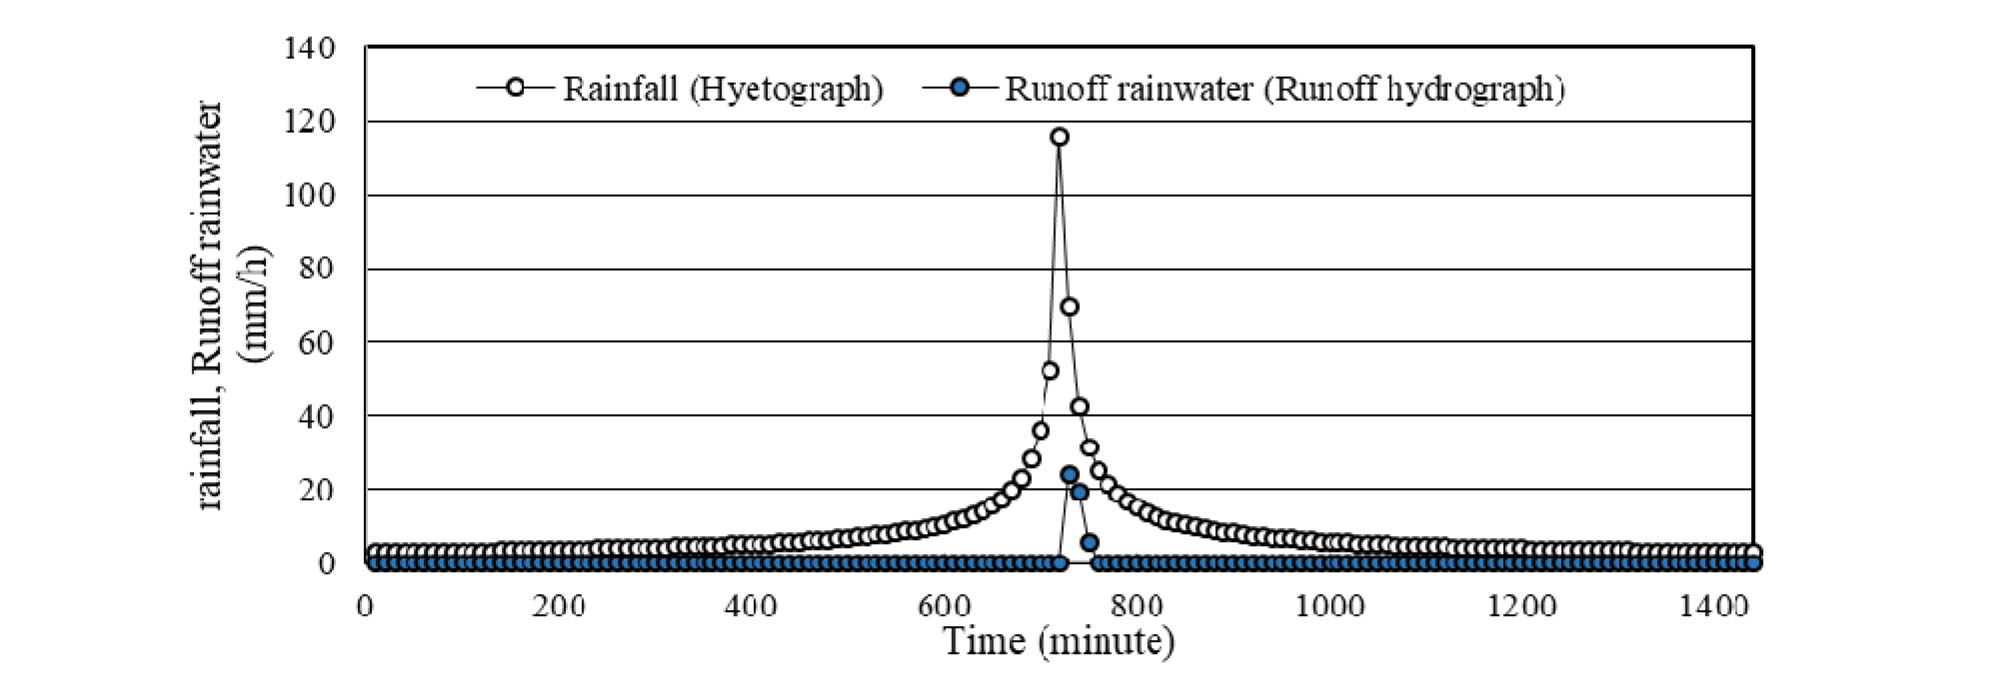
In this case study, the saturated permeability coefficient of the subgrade is high and the air void and the expected permeability coefficients of each material are also high. Therefore, almost of rainfall permeates into the subgrade, the surface runoff does not take place, and the runoff amount to the drainage facilities like a river is very small as shown in Table 12 and Fig. 7.
Table 12.
Simulation results
Actually, we have wasted a lot of time to determine the pavement structure and the materials used and we did not have enough time to simulate the runoff amount from the permeability pavement. If we have evaluated the drainage design along with the determination of the pavement structure and materials, a more effective and efficient design should have been carried out. This is a point we should reflect on and a meaningful finding.
6. Summary
The urban floods have taken place so far many times even in many urban area. If the runoff amount of the rainwater through the permeability pavement would be able to reduce, the problem with the urban flood should be significantly improved. In spite of the fact that the calculation method has been developed by PWRI in 2005, it looks like the calculation method has not yet been employed widely. As shown in this paper, this calculation method is very difficult and complicated but very meaningful and available to evaluate and estimate the damage by high-intensity rainfall.
And, the most important thing is that the runoff amount of rainwater can be easily simulated. Therefore, this method can be able to be employed when the effects on the urban flood are quantitated even in changing the conventional pavement into the permeability pavement.
