

1. Introduction
2. Materials and Methods
2.1 Materials
2.2 Mixture Preparation
2.3 Kim Test
2.4 CPWT test
2.5 Field Rut and Core SD of Street Pavements
3. Results and Discussions
3.1 Binder Test and Mix Design Results
3.2 Correlation Analyses
3.3 Discussions
4. Conclusions
1. Introduction
It is difficult to estimate rutting potential of asphalt mixture by any simple property test, although there are several well known static strength test procedures for measuring engineering property of asphalt mixture, including Marshall Stability. Most of these test procedures are simple, but test results have been known to have little correlation with rut potential of asphalt concrete (Kim et al., 2019; Bibek et al., 2020). Other works were made on this issue for simple performance test for estimating asphalt mixture property (Hafez, 1997; Pellinen and Witczak, 2002). Their proposals were also not accepted as legitimate procedures due to lack of correlation with rutting. Therefore, no plausible static-loading test was available until when the strength against deformation, or deformation strength (SD) was introduced as a potential tool for rut- resistance estimation (Kim et al., 2004a; Lee et al., 2004; Doh et al., 2007; Kim et al., 2007, 2008, 2011a). The SD of asphalt mixture was measured by a static loading on top center of specimen through a round-edged rod to measure the failure load and vertical deformation at failure at 60°C, and was adopted as a strength criterion of mix-design of asphalt mixture in Korea.
Mixture rut resistance depends on binder stiffness (G*/sin δ) if the same aggregate and gradation are used for the asphalt mixture. The high value of G*/sin δ is considered desirable from the stand-point of rut resistance (SP-1, 2002). It is hypothesized that the mixture strength showing high correlation with binder G*/sin δ will be a reliable property for predicting rut resistance. According to may lab test results, the SD showed high correlations with binder stiffness and absolute viscosity (Kim et al., 2008, 2011a, 2011b). It was also shown that the SD had high correlations with wheel tracking (WT), asphalt pavement analyzer (APA) and dynamic creep test results in many studies (Skoke et al., 2002; Kim et al., 2003, 2004b; Cho, 2005; Kim et al., 2011a, 2019). These results imply that the SD is a strength property which has high correlation with rut resistance of asphalt mixture. Therefore, there is a good possibility for having highly rut-resistable pavement if the asphalt mixture satisfying the SD criterion is paved.
However, the SD has been so far proved to have high correlations with rut-related binder and mixture properties of lab-prepared materials based on lab test results. In addition to lab test results, further validation of SD was investigated based on actual field data; the rut-depth and SD data from street pavements and from circular pavement wheel tracker (CPWT), a semi accelerated loading facility (ALF), in this study. Therefore, the objective of this study is to examine correlation between SD and rut data of actual field and semi-field asphalt pavements, and to find out suitability for implementing SD as the representative strength for rut resistance of asphalt mixture. If the study reveals the suitability successfully, the SD usage can be extended for practical field application, such as strength inspection for field quality control (QC), in addition to current use for a mix-design criterion.
2. Materials and Methods
2.1 Materials
Two nominal maximum aggregate size (NMAS) coarse aggregates (13 mm and 19 mm) were used together with screenings as fine aggregate and limestone powder as mineral filler for the dense-grade asphalt mixture for surface course for CPWT test. The 13 mm and 19 mm were from gneiss-base and granite-base rock quarries, respectively, and combined gradations are shown in Fig. 1. A normal asphalt, a brand of premixed polymer-modified asphalt (PMA) and two lab-blended PMAs were used. The polymer for PMA brand was styrene-butadiene-styrene (SBS) and two lab-blended PMAs were prepared using a recycled low-density polyethylene (RLDPE) and a crumb-rubber modifier (CRM). The RLDPE powder (6 wt% of total binder) was mixed into the heated aggregates and binder when blending with a lab paddle mixer (dry method). The CRM (10 wt% of total binder) was blended with asphalt using a homogenizer for 0.5 hour at 180°C (wet method). The performance grade (PG) values of the four binders were measured using DSR and are shown in Table 1. G*/sin δ values at 64°C for each binder were used for regression analyses.
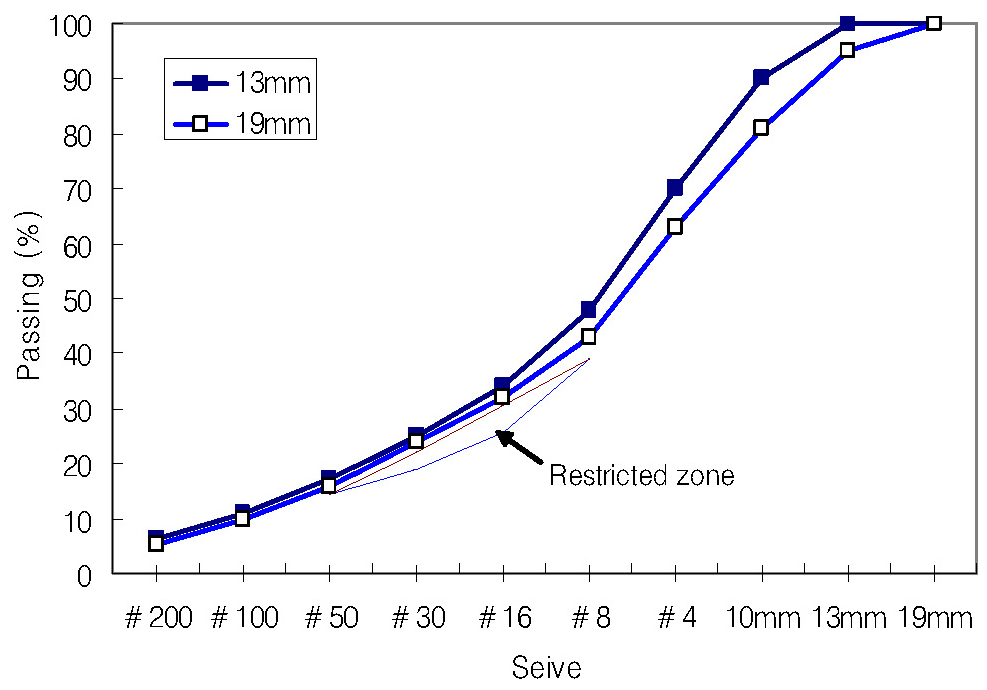
Table 1.
Description of binders used in this study
| Abbreviation | COa | RL6b | R10c | PMA |
| Polymer | None | Recycled LDPE | Crumb rubber modifier | SBS |
| Content (%) by wt. of binder | 0 | 6 | 10 | Un-known |
| PG | 64-22 | 76-22 | 70-22 | 76-22 |
2.2 Mixture Preparation
Eight asphalt mixtures were prepared by Korean mix-design guide for surface course of asphalt pavement (MOLIT, 2021). The blended mixes were kept in an oven for 1 hour for short-term aging at 160°C for CO and R10 mixes, and at 170°C for RL6 and PMA before compaction. Numbers of gyration using a Superpave gyratory compactor were 75 for CO and R10 and, and 100 for RL6 and PMA mixes, respectively.
The criteria for Korean mix-design consist of four properties, three physical properties including air void ratio, voids filled with asphalt (VFA) and voids in mineral aggregates (VMA), and one strength property, the SD. The specification limits of air void ratio and VFA are 4% and 65~80%, respectively, and those of VMA for 19 mm and 13 mm aggregates are 13% and 14%, respectively. The specification limits of SD are SD ≥ 3.20 MPa and SD ≥ 4.25 MPa for 2nd class and 1st class highway pavement surface course, respectively. The optimum asphalt content (OAC) was determined at the air void ratio of 4% with other properties being satisfied the limits. The specimen size was 100mm in diameter and 63mm in height for mix design and SD test.
2.3 Kim Test
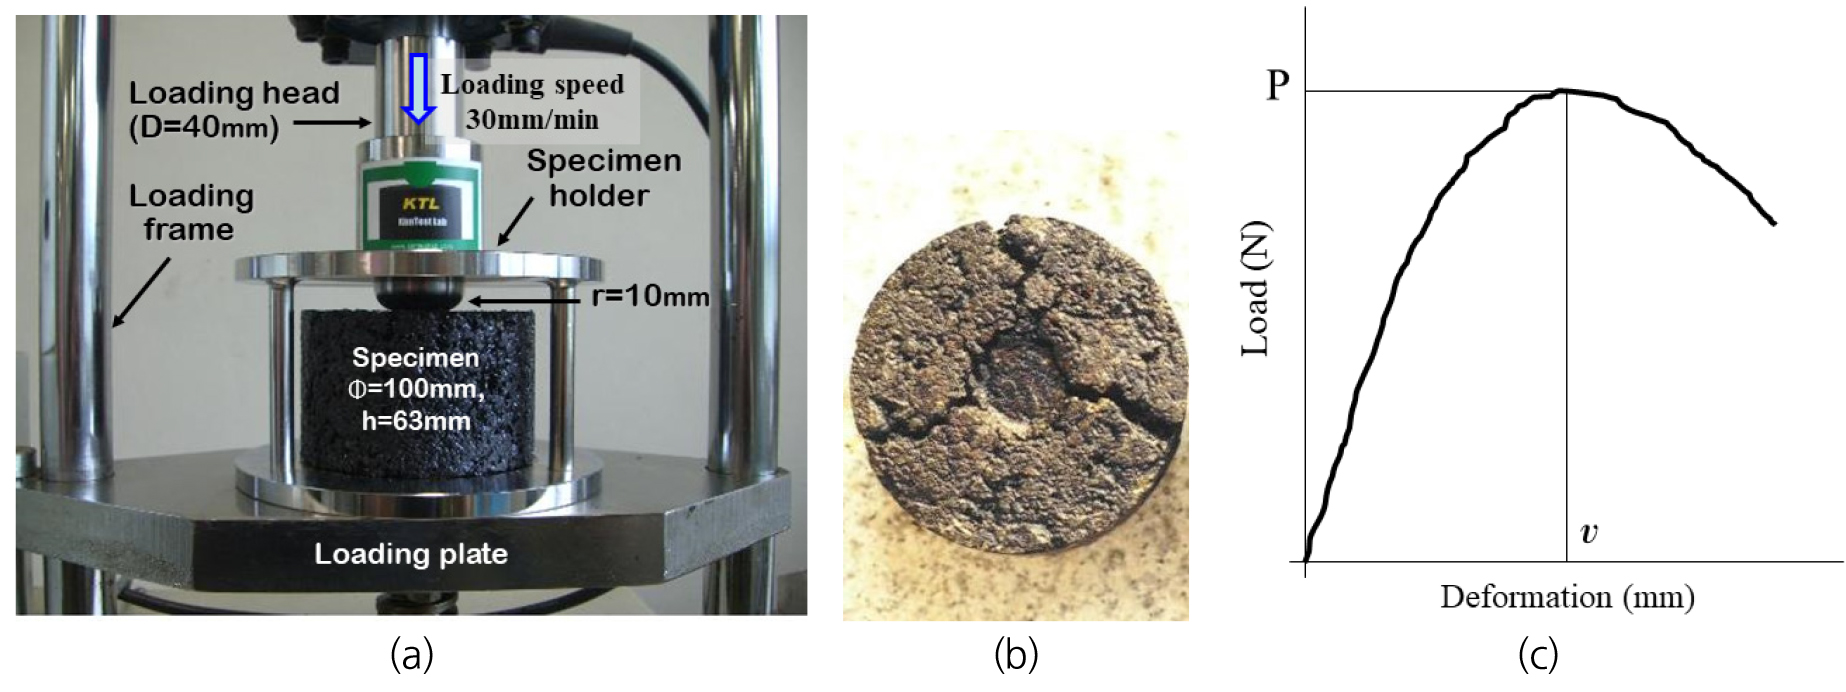
For measuring deformation strength (SD), a static load is applied on top center of specimen through a rod (loading head), which has a round edge as shown in Fig. 2(a), and this test method is called as “Kim test.” When the specimen was failed with dimple-shape deformation (Fig. 2(b)), a load-deformation curve (Fig. 2(c)) was obtained. The peak load (P) and the deformation (v) at the peak load point were obtained from the curve as primary variables in this test. The SD is then calculated by dividing the maximum load, P, by the area of dimple diameter, Ad, or SD = P/Ad. The diameter (D) and edge curvature radius (r) of the loading head were determined to be 40mm and 10mm, respectively, for 100mm diameter specimen (Lee et al., 2004; Doh et al., 2007; Kim et al., 2011a). Eq. (1) was used for computation of SD.
where, SD = deformation strength (MPa), P = peak load (N) at failure, and v = vertical deformation (mm) at P. This equation is valid for v = 0 to 10 mm. When v is greater than 10 mm, 10 mm should be used as v, although it is very rare case.
A set of 3 specimens was prepared from CPWT mixes which were paved at test-pit on paving day, and a set of four specimens was obtained by coring after CPWT test. A set of 3 core specimens were obtained from surface course of street pavements at each site for rut-depth measure. The specimen was submerged into the 60°C water bath for 30 min and removed before being placed in the loading frame in which a load was applied at the speed of 30 mm/min. More details for Kim Test were reported elsewhere (Kim et al., 2004a; Lee et al., 2004; Kim et al., 2008; La et al., 2009; Kim et al., 2011a, 2020).
2.4 CPWT test
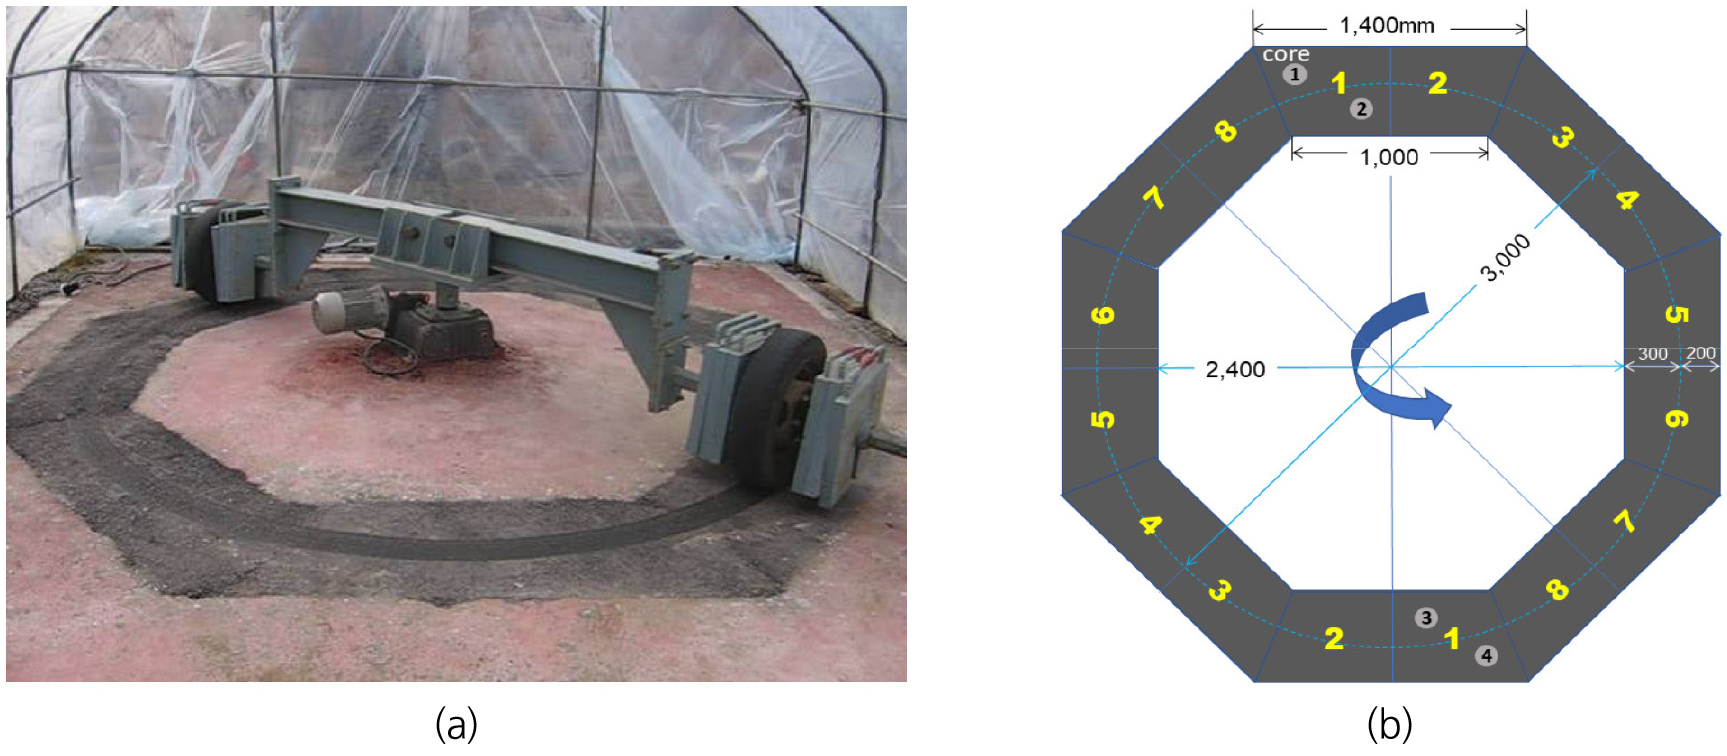
A circular pavement wheel tracker (CPWT) was developed as a semi-accelerated loading facility (ALF) (Kim et al., 2006, 2008, 2010, 2022a, 2022b). Even though there are many ALF systems developed, their equipments are expensive and some procedures are rather complex to operate (Kandhal and Cooley, 2003). However, the CPWT is simple and easy to operate as shown in Fig. 3(a).
The designed mixture was prepared in lab and paved using a roller compactor at CPWT test site. Each of eight mixtures was placed in two opposite sites in eight faces of hexagon, facing each other as shown in Fig. 3(b). Approximately 72 kg of each mixture was placed in two opposite sites at the depth of 50 mm using a roller compactor. A lab pug-mill mixer, which can mix an 86 kg of hot-mix asphalt in one batch, was used for preparing each mix. Each mixture sample was randomly collected before paving for SD test.
The running speed of CPWT was 9 rpm to simulate approximately 5 km/hour of each wheel speed with the tire pressure of 100 psi. One period of run was operated for 72 hours, 4-5 hours per day, in hot-summer day from middle of July to early August. CPWT operating started when the surface temperature reaches near 50°C at around noon and ended between 4:00 pm and 5:00 pm every day. The surface temperature of the site pavement during operation time was 53°C on average. Rut depth was measured for record every day after running stop, and final rut depths were used for analysis.
Three specimens were made for SD test using randomly collected sample of each mix on paving day. Four cores were taken from each site (two each side) near wheel path after completion of CPWT run as shown in Fig. 3(b) for measuring SD of paved mixes. Six final rut depths at two opposite sites (three of each) were measured and four SD values were measured from each mix cores. Eight sets of average rut and SD data were used for regression analysis.
2.5 Field Rut and Core SD of Street Pavements
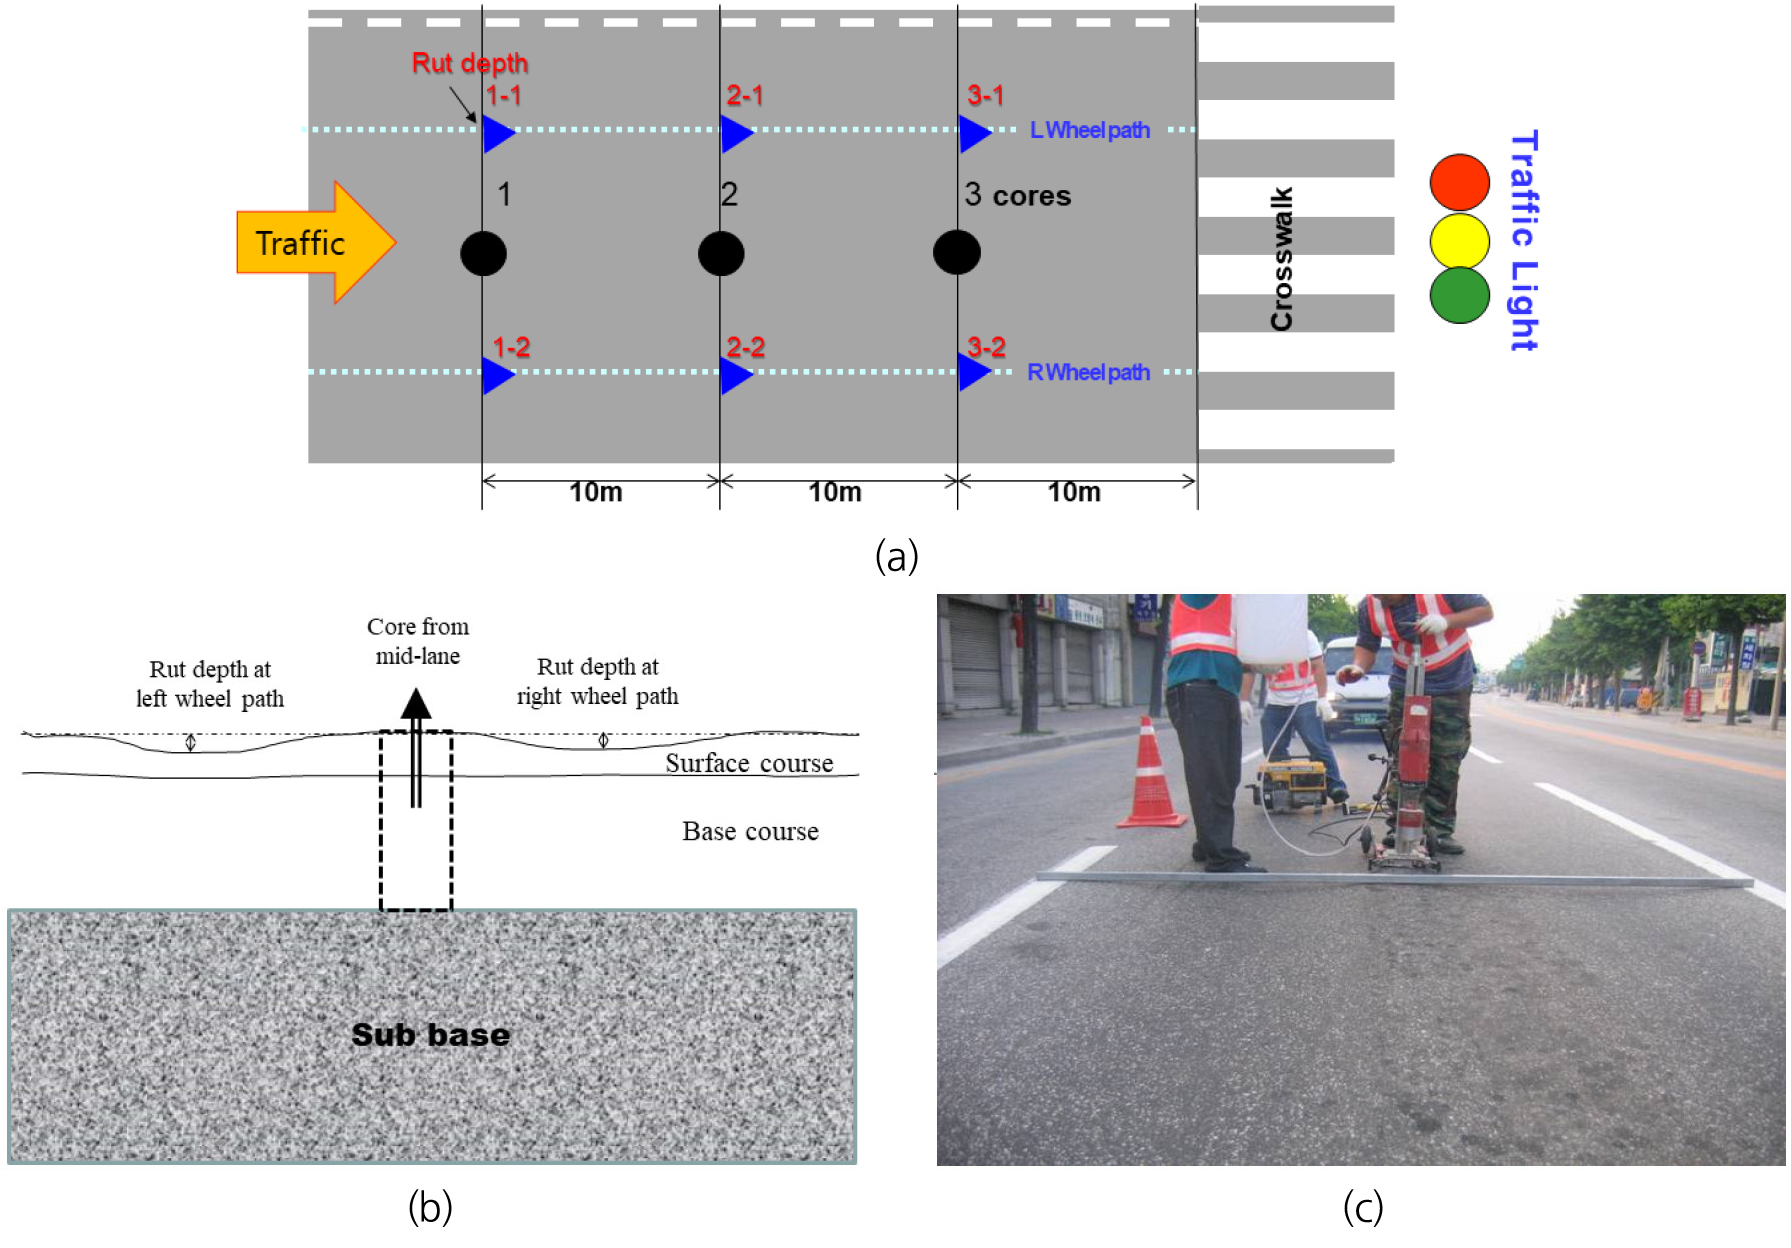
Field cores (100 mm diameter) were taken from 23 sites of street pavements in the city of Chuncheon, Korea. Three cores were taken and six rut depths were measured from one site before crosswalk with traffic light, as shown in Fig. 4(a). The surface course of core was cut using a masonry saw and used for a SD test. Average of three SD values measured from three cores and average of six rut depths on existing asphalt pavement were used as one point for regression analysis. The traffic conditions and materials used for the pavement were not investigated, but only rut data and SD values of cored specimen were obtained to investigate how much the SD had correlation with rutting of existing asphalt pavement. The pavement mix type of street surface course was observed to be all dense-graded asphalt mixtures. A total of 23 data sets were collected and used for regression analysis between rut depth data and SD values.
3. Results and Discussions
3.1 Binder Test and Mix Design Results
The results of DSR test are shown in Table 2 together with the mix design results of eight mixes for paving CPWT test pavement. The PG grade of each binder determined by DSR test was already given in Table 1, and G*/sin δ values at only 64°C are shown here for regression analysis. The mixture with higher G*/sin δ showed a higher deformation strength (SD), suggesting that the G*/sin δ is well reflected to the mixture’s SD. The SD values of CO and R10 mixes satisfied 3.2 MPa, the minimum limit of surface course for the 2nd class highway pavement, and those of PMA and RL6 mixes satisfied 4.25 MPa, the minimum for the 1st class highway pavement by Korean mix-design criteria (MOLIT, 2021). In general, the 19mm-aggregate mixes showed higher SD values than 13 mm mixes.
Table 2.
Results of binder DSR test at 64°C and mix design for CPWT mixtures
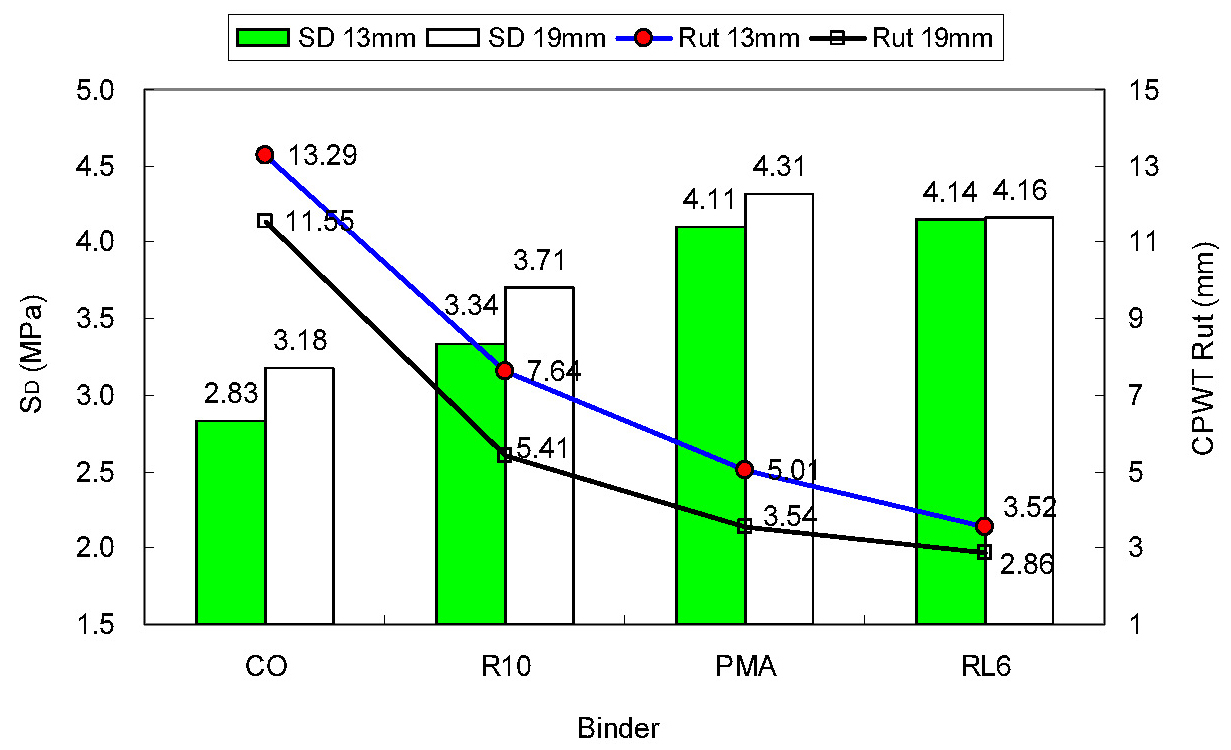
Table 3 shows two types of SD values, one measured from the specimens prepared using the mixes for CPWT site paving (paving-mix specimen), and another from the cored specimens taken from the CPWT pavement after finishing test (cored specimen). The SD of paving mix is the average of 3 specimens, and that of CPWT cored specimen is of 4 specimens, two from each opposite site, as illustrated in Fig. 5(b). The CPWT rut-depth values shown in Table 3 are the average of final rut depth of two opposite sites after finishing 72 hours CPWT run. Shallow rut depths were measured, in general, from stiffer binder-mix and larger-size aggregate-mix sites. Fig. 5 illustrates the average SD of three mixes (design mix, paving mix and core) and by NMAS and corresponding CPWT rut depth by binder. Two 76-22 binder mixes (PMA and RL6) showed the higher but identical SD level than two lower grade mixes (70-22 of R10 and 64-22 of CO); an apparent SD increase, and resultant rut depth decrease by PG level enhancing.
Table 3.
SD and rut depth of CPWT
3.2 Correlation Analyses
3.2.1 CPWT Test Data
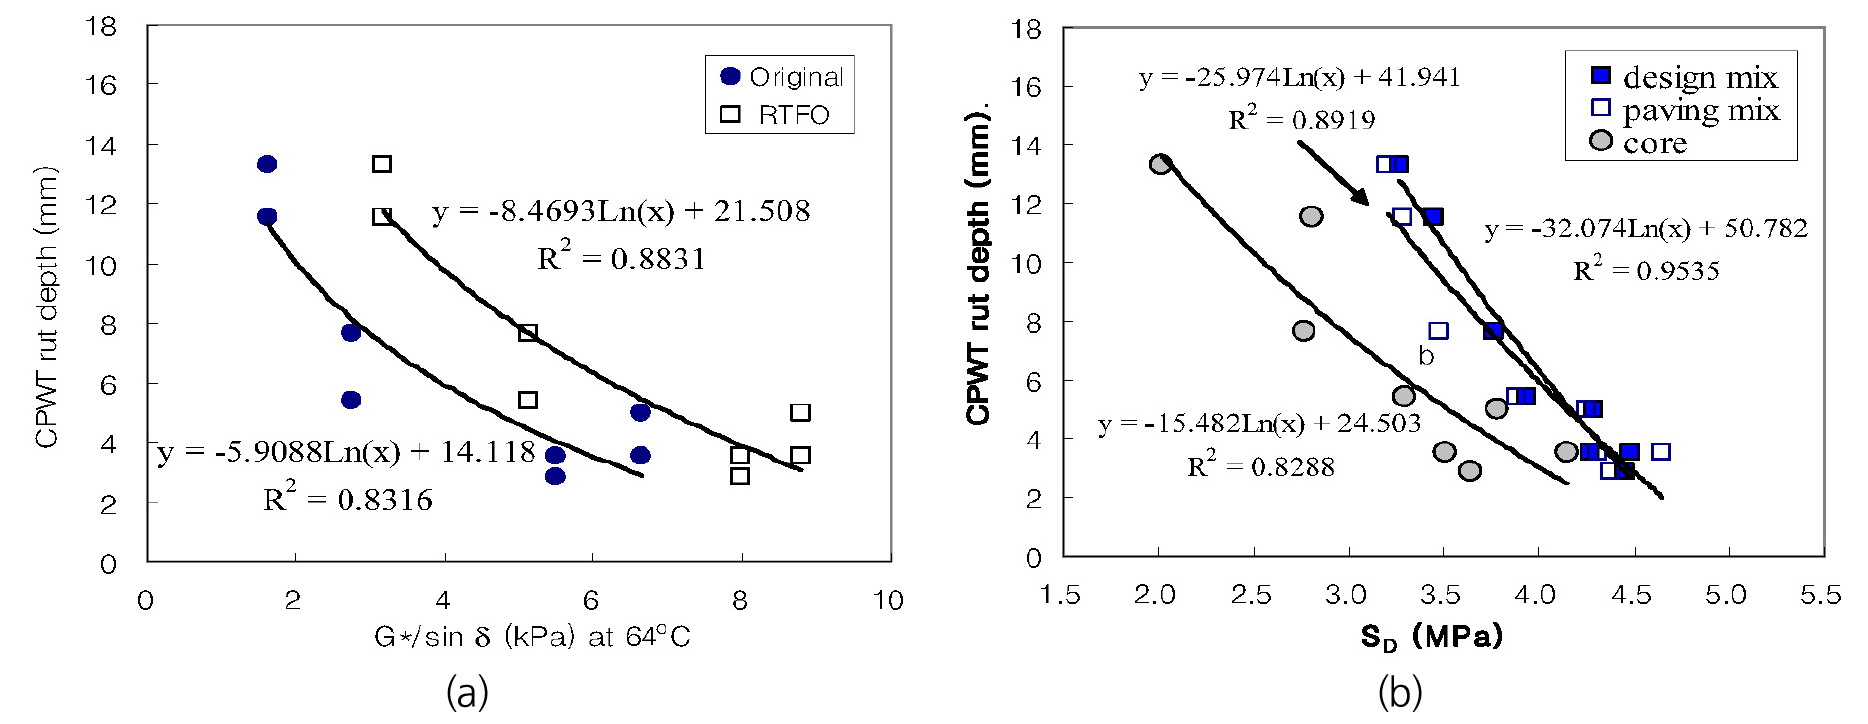
Previous works showed that the coefficient of determination, R2, values between WT rut depth and G*/sin δ, and lab mix SD and G*/sin δ were 0.85 or higher (Kim et al., 2003, 2004a; Doh et al., 2007; Kim et al., 2011a, 2011b, 2019). Final rut depths of CPWT test were observed to show relatively good correlations with binder stiffness (R2 = 0.8574 on avg. of Fig. 6(a)) and with SD values (R2 = 0.8914 on avg. of Fig. 6(b)). These results indicated that the mixture rut potential was properly distinguished by using CPWT test. As mentioned earlier, the rut depth difference in this study is purely due to from binder stiffness because the aggregate gradation was the same. The rut resistance difference due to binder stiffness was well recognized through CPWT test, a simple wheel tracking run on circular asphalt pavements. Between average R2 values of 0.8574 and 0.8914 for Fig. 6(a) and (b), respectively, the rut depth values measured by CPWT test were found to have higher correlations with SD values than with binder stiffness values.
Although it was measured by simple static-mode test, the higher the SD, the lower the rut depth, standing for rut resistance of asphalt mixture consistently. Since SD was found to have high correlation with mixture rut resistance, SD can be considered as a suitable strength for estimating rut resistance of asphalt concrete. Therefore, it is possible to state that SD is a strength property representing rut-resistance of asphalt concrete. It is also possible to state that Kim Test is a plausible tool for rut tendency estimation of asphalt mixture, and the CPWT is a convincing semi-ALF test technique for rut resistance evaluation of asphalt mixtures.
3.2.2 Field Rut Data
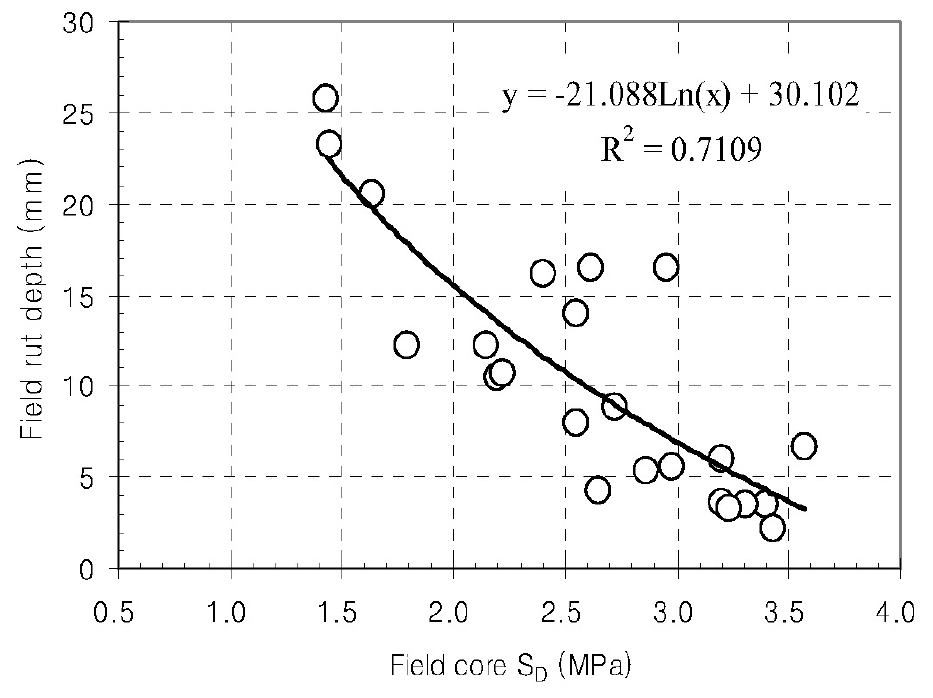
For further validation using actual field data, field rut and SD data were collected from 23 sites of street asphalt pavement before crosswalk in a crossroad with traffic lights. Fig. 7 shows the regression between rut depth and SD values using 23 data points, which were measured from existing street asphalt pavements in the city of Chuncheon, Korea (Kim et al., 2008; Kim and Kim, 2021). An SD was measured from the surface course of core taken out of mid-lane of the same lane pavement where the rut depths of both wheel paths were measured as illustrated in Fig. 4. At one location, three SD values from three cores and 6 rut depths from both wheel paths of three core locations were obtained. The one point for the regression in Fig. 7 is from the averages of the 3 SD values and 6 rut depths.
The regression analysis result shows that the rut depth of street pavement showed a fairly good correlation with SD of the site pavement, with R2 = 0.71. According to Fig. 7, if the pavement showed SD of 3.2 MPa or higher (the MOLIT minimum criterion for 2nd class highway pavement), the rut-depth of the site pavements were measured to be very shallow (5 mm or lower on average). On the other hands, the SD values of the site pavements with deeper rut depths (20 mm or higher) were turned out to be very lower level, approximately 1.6 MPa or lower.
As mentioned earlier, no pavement information regrading paved materials and traffic conditions were considered. However, the asphalt pavements which exhibited lower rut depth (strong rut resistance) at the time of coring did show strong SD strength. Therefore, if the pavement mixture shows strong SD, it is possible to state that the site pavement will have to exhibit high resistance against rutting. In other words, if the asphalt mixture satisfying SD criterion was paved, the pavement would show durable rut resistance during in service.
3.3 Discussions
It is well known fact that the rut resistance of asphalt mixture is function of binder rutting factor, aggregate size and gradation, and mixture strength. However, the mixture strength is not considered as a criterion in Superpave Level I mix design. In this study, since the SD was proved to be an important strength against rutting, if the asphalt mixture is designed with strong SD, the pavement will show strong rutting resistance. Therefore, it is surely a reasonable practice to have a SD level in mix design criterion for a certain class highway pavement, as already employed in Korean Mix-Design Guide (MOLIT, 2021).
In this study, it was found that the rut resistance characteristics of asphalt mixes were estimated reliably through the SD on lab-prepared mixes, paved mixes and cores. Therefore, there is good possibility for implementing the SD for quality control (QC) of paving mixture for the purpose of checking strength level, which would provide strong enough resistance against rutting, like the strength QC inspection of field cement concrete. Like as the compressive strength, which is considered as a fundamental strength property of cement concrete, the SD can be used as essential strength property of asphalt concrete mixture. For strength QC of paving mix, the field mix should be randomly sampled at paving site, and for the paved mix, the field cores should be taken to measure SD. For field mix criteria, however, further studies should be performed for the proper limits suggestion by mixture type and road class.
Kim Test was evidenced to be a convenient and dependable static-mode test technique for estimating rut potential of asphalt mixture by measuring SD. Rut resistance characteristics were also confirmed by CPWT test on paved mixtures. Therefore, CPWT is relatively simple, economical and practical semi-ALF. To prepare a strong mix against rutting with given aggregate and gradation, it will be a reasonable practice to select a strong-grade binder first, to design the mixture in view of stronger SD, and then, to check the mixture by CPWT test before field application.
4. Conclusions
This study analyzed correlation between deformation strength (SD) and rut depth data of actual field and semi-field asphalt pavement mixtures in circular pavement wheel tracker (CPWT), in addition to binder stiffness () dada in the lab. The objective of this study was to provide suitability of implementing SD as the representative strength for rut resistance of asphalt mixes based on actual field rut and SD data from actual street pavements and CPWT test. According to correlation analyses results of SD vs. G*/sin δ, SD vs. CPWT rut depths, and SD vs. street pavement rut depths, following conclusions were drawn.
1. The SD data were found to show high correlations with binder stiffness (G*/sin δ) data (R2 = 0.83~0.88), with rut depths of CPWT (a semi-ALF) tests (R2 = 0.83~0.95), and with the rut depth data of street pavements (R2 = 0.71).
2. Since the SD was a strength property showing high correlation with rut resistance of asphalt mixture from the field and semi-field test, and therefore, the SD was found to be suitable strength property for estimating rut resistance of asphalt pavement in service.
3. The MOLIT mix-design guide already employed the SD as a strength criterion based mostly on lab test data. Since the SD showed high correlations with rut depth data of semi-field and actual field mixtures, SD use can be extended to field application, such as strength quality control (QC) of field asphalt mixtures.
4. It was also showed that Kim test was evidenced to be reliable static-mode test protocol for measuring SD of asphalt concrete at 60°C, and the CPWT was a simple but reliable semi-field rut-test technique for asphalt mixture in a circular wheel track, a relatively simple facility.
However, since the results of this study were from limited data to some extent, further studies are suggested by using more field data, and more binders, different aggregate sizes and gradations for CPWT test to reach further conclusive validation.
