

1. Introduction
2. Research Objective
3. Information of Selected Pavement Section
4. Asphalt Mixture Test Set Up
5. Background Theory
6. Data Analysis
7. Summary and Conclusion
1. Introduction
The current expressway length of South Korea is reached approximately 4,500 km (Kim et al., 2023). This means not only construction but also proper management are essential especially on expressway (Kim et al., 2019; Kim et al., 2023). The Korea Expressway Corporation (KEC) recognized this expressway management issue since 1990 and launched Highway Pavement Management System (HPMS) (Lee et al., 2015; Kwon, 2017; Lee et al., 2017).
The main activities of HPMS are consisted of two categories:
1. Development of optimized pavement surface condition criteria
2. Development of effective pavement surface monitoring equipment
In case of setting pavement surface condition criteria, Highway Pavement Condition Index (HPCI) is generally applied (MOLIT, 2013; Kwon, 2017; Ryu et al., 2021; Kim et al., 2023; Road Korea Pavement Research Team, 2023).
The equation of HPCI can be expressed as:
Where,
IRI=International Roughness Index (m/km),
RD = Rut depth (mm),
SD = Surface Distress (m2)
The higher value of HPCI indicates positive condition of expressway roadway network. The rehabilitation needs of existing expressway is decided based on HPCI results (Sohn et al., 2018; 2021).
Table 1 presents the current HPMS criteria in South Korea expressway network.
Table 1.
HPMS criteria in South Korea (for asphalt and concrete pavement)
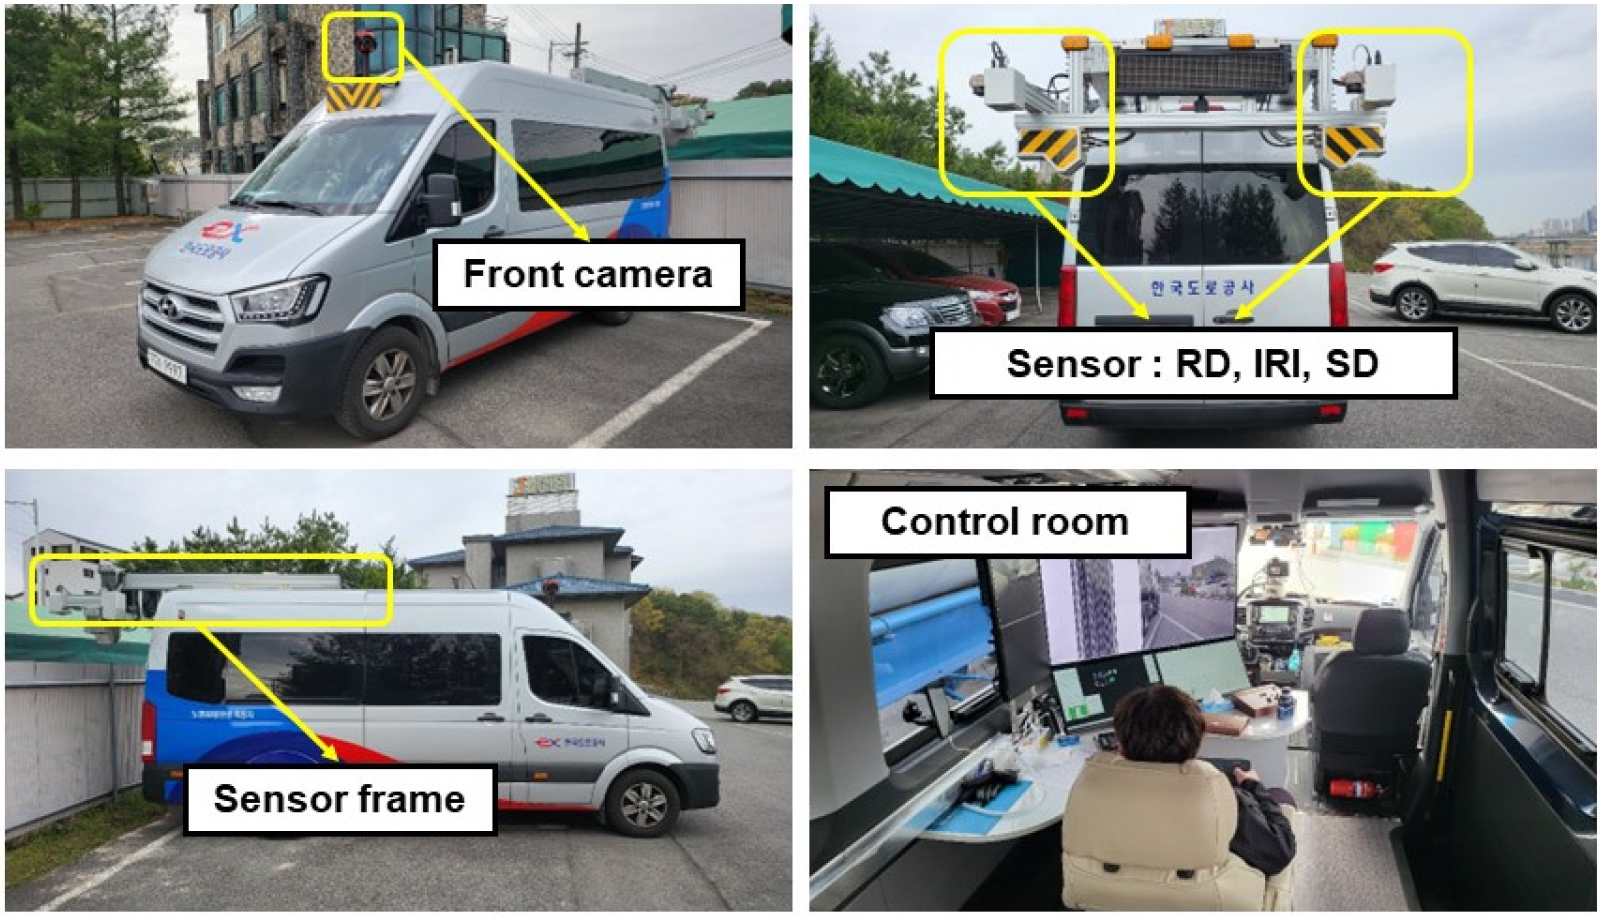
During past decades, KEC developed a remarkable and efficient pavement surface monitoring equipment so called: 3-Dimensional Pavement condition Monitoring profiler vehicle (3DPM) (Sohn et al., 2018; Sohn et al., 2021). This 3DPM vehicle can survey not only smoothness but also condition of pavement successfully along with advanced complicated laser sensor system (Sohn et al., 2018; 2021). The picture of 3DPM vehicle is presented in Fig. 1.
However, there can be some questions of current HPMS feasibility. Because all these actions are limited only on surface of pavement. Therefore, actual performance test analysis work is needed to strengthen the effectiveness of current HPMS.
2. Research Objective
In this paper, low temperature creep performance on selected asphalt pavement layer section was evaluated to strengthen and verify the current HPMS including criteria and 3DPM technology. As a research procedure, the following steps were taken.
1. A pavement target sections was considered where good and bad sections co-exist.
2. Secondly, the HPCI values were computed by means of 3DPM equipment on selected pavement section.
3. Thirdly, asphalt mixture coring work and corresponding BBR mixture creep test (Marasteanu et al., 2009; AASHTO M320-10, 2010; Moon, 2010; AASHTO T313-12, 2012; Moon, 2012; Moon et al., 2014) was performed.
4. Then thermal stress values were computed then compared based on BBR creep testing.
5. Finally, the feasibility of HPMS was evaluated.
3. Information of Selected Pavement Section
In this paper, asphalt pavement sections around Gwang-Ju, South Korea where good and bad pavement sections co-exist was selected. Then 3DPM vehicle was used to survey pavement condition and compute HPCI values.
The following procedure was performed for selecting specified pavement target section in this paper.
1. Survey the expressway network both good and bad sections with 3DPM system near Gwang-ju city in South Korea (length is more than 20km).
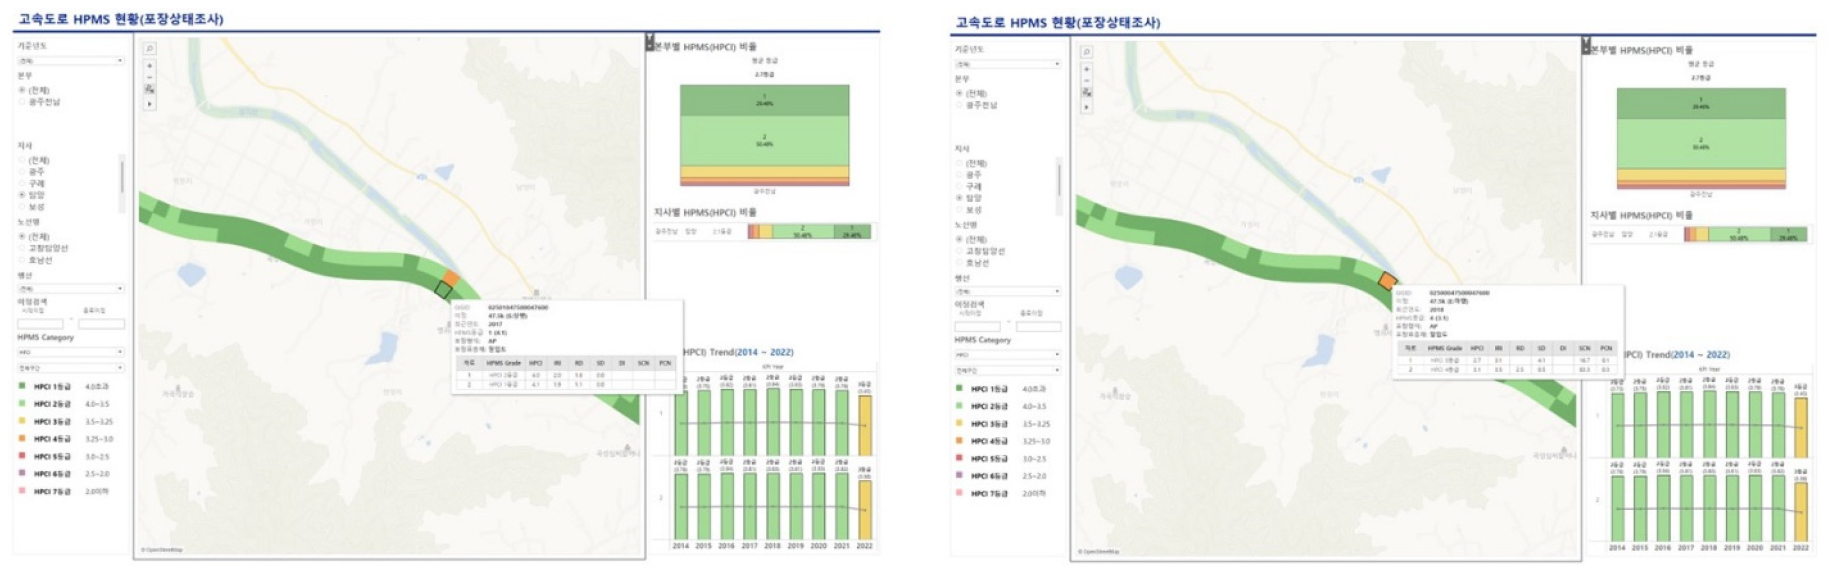
2. Select two specified pavement sections show both good and bad pavement surface conditions through 3DPM and AIG (Tableau, 2023) approaches (see Fig. 1 and Table 2).
Fig. 2 and Table 2 present the information of tested pavement section in this paper.
From the results in Table 2, some crucial findings could be derived:
1. Based on 3DPM approach, good and bad pavement surface section can easily be distinguished and recognized.
2. These findings are limited into only surface of pavement.
3. It may be assumed that there will be a correlation between surface condition and inner layer condition of pavement. However, these assumption needs to be found based on actual experimental work.
Due to these reasons, an actual experimental work for asphalt mixture named: Bending Beam Rheometer (BBR) creep test was considered in this paper. More information is given in the next section.
4. Asphalt Mixture Test Set Up
After surveying the selected pavement surface, asphalt mixture cores were acquired for further BBR mixture testing Marasteanu et al.(2009)(AASHTO M320-10, 2010; Moon, 2010; AASHTO T313-12, 2012; Moon, 2012; Moon et al., 2014). In each pavement section, three mixture cores were acquired and finally six asphalt mixture beams were prepared with the following dimension: length (l) : 120 mm, width (b) : 12 mm and depth (h) : 6 mm, for BBR experimental work (Marasteanu et al., 2009; AASHTO M320-10, 2010; Moon, 2010; AASHTO T313-12, 2012; Moon, 2012; Moon et al., 2014). The schematic information of BBR mixture test is presented in Fig. 3 and Table 3.
After the extensive experimental work, crucial material performance results such as creep stiffness: S(t), creep compliance: D(t), relaxation modulus: E(t) and thermal stress: (T°C) were computed then compared (Moon, 2010; 2012). More detailed information is provided in the next section. It should be mentioned that more relaxation ability on given asphalt material at low temperature condition is crucial. Therefore, lower value of S(t) and corresponding (T°C) are good for bituminous material especially asphalt mixtures.
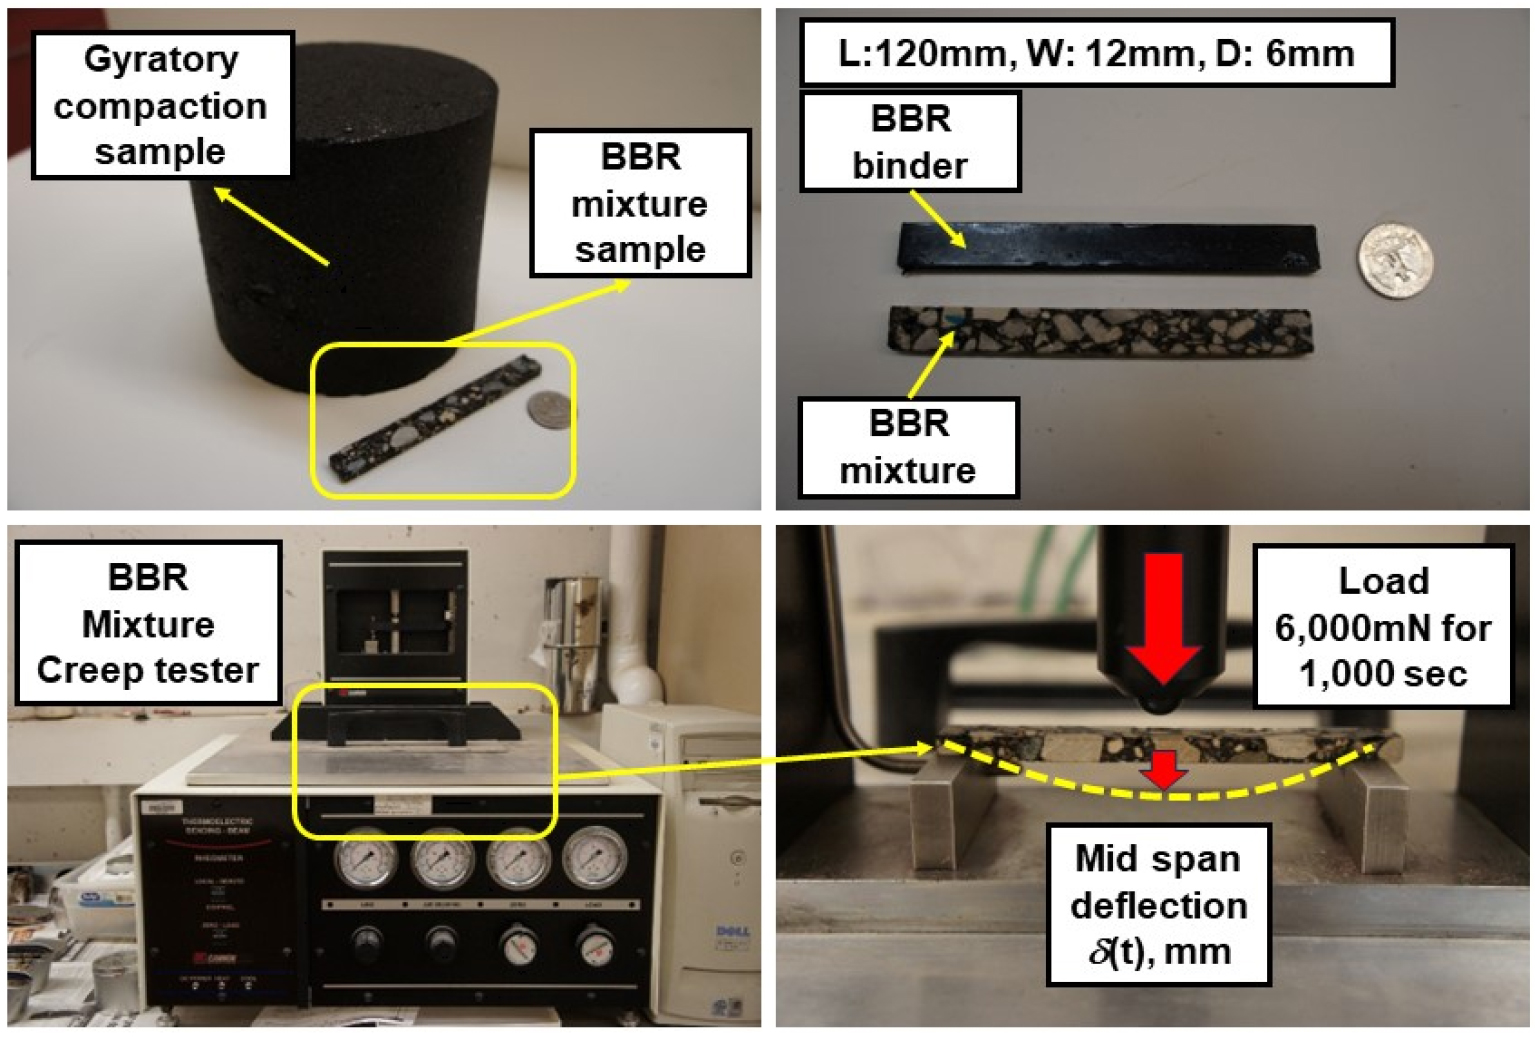
Table 3.
Schematic information of BBR mixture creep test set up
5. Background Theory
In BBR mixture creep test S(t) can be computed as (AASHTO T313-12, 2012):
Where,
σ = maximum bending stress,
ε(t) = bending strain,
P=6,000 mN (for 1,000 seconds),
(t) = mid-span deflection and t is time (0~1,000 seconds),
l = 120±5 mm, b = 12±3 mm, h = 6±1.5 mm (BBR specimen dimension)
Then E(t) can be computed as following steps:
1. It is known that E(t) and D(t) can be inter-related through the experimental expressions (i.e. Power law function) and convolutional integral as (Findley et al., 1976; Ferry, 1980; Park and Kim, 1999):
2. Equation (4) can be re-expressed as:
3. By using Gamma function, E(t) can be finally computed as:
From the Equations (2), (3), (4), (5), (6), (T°C) can be computed based on the following steps:
1. Construction of E(t) master curve from Equation (6)
Where:
Eg = glassy modulus, assumed equal to 30~40 GPa for asphalt mixtures (Moon, 2010),
tc, v and w = fitting parameters.
aT = horizontal shift factor which can be expressed as:
C1, C2 = constant parameters, and
Ts = reference temperature (°C, in this paper lowPG+10°C).
2. Compute (T°C) from simple numerical procedure mentioned elsewhere (Moon, 2010; 2012).
where:
= strain rate which can also be expressed as:
= Coefficient of thermal expansion or contraction; assumed =0.00003 (Moon, 2010),
= temperature cooling rate
In this paper, (T°C) was computed from 22°C to -40°C with 2°C/hour cooling rate application (Moon, 2010; 2012).
6. Data Analysis
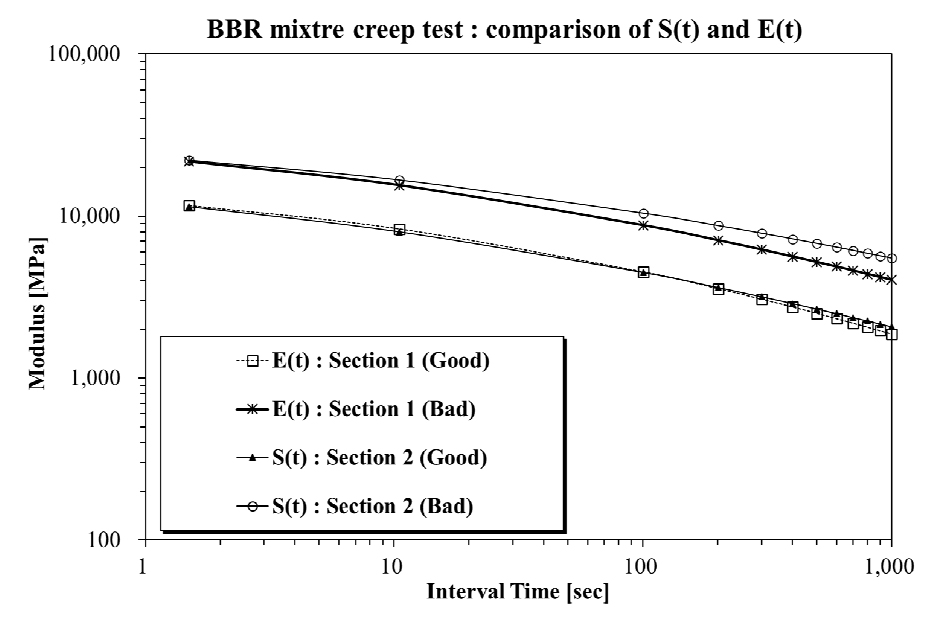
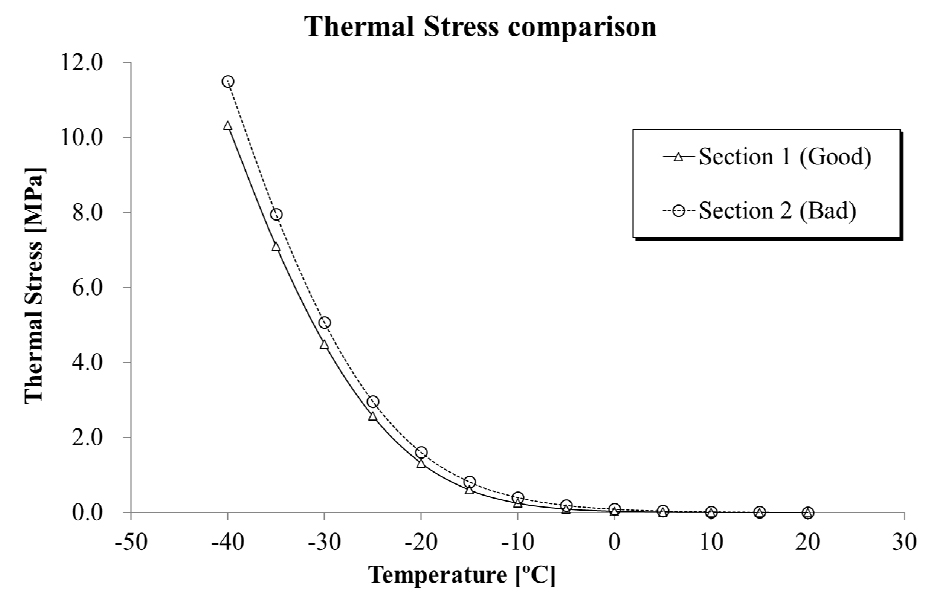
The results of Creep stiffness : S(t), Rerlaxation modulus : E(t) and corresponding thermal stress : (T°C), are shown in Figs. 4 and 5.
From Figs. 4 and 5, some crucial findings could be derived:
1. For comparison of S(t) and corresponding E(t), remarkably lower values were found on good section compared to the bad section.
2. In case of (T°C) comparison, good section preseinted remarkably lwer values comparedf to bad section.
Therefore, two final conclusions can be derived:
1. There is a correlation between surface condition and inner layer condition on surveyed pavement section.
2. The current 3DPM approach can successfully provide reasonable pavement condition not only on surface but also in inner property.
However, only one pavement section was considered in this study due to limitations on activity. More extensive surveying work and experimental activities are need to further strengthen the findings in this paper.
7. Summary and Conclusion
The importance of expressway management became important in South Korea since early 2000. To follow this pavement business trend, KEC developed pavement management criteria named: HPCI. Moreover, KEC developed an advanced equipment named: 3DPM, which can survey and monitor pavement surface condition. One of the questions was: there can be correlation between surface and inner pavement layer. In this paper, not only surveying work but also experimental work was considered to provide feasibility of current HPMS and 3DPM approach. As a result, reasonable correlation between pavement surface condition and inner layer condition was found. Therefore, it can be said that current HPMS and 3DPM can be reasonable approaches for monitoring and managing expressway. However, only one pavement section was considered in this paper. More extensive experimental works are needed as a future research approach.
